Next Generation FOSS Web Mapping with MapboxGL
Hi Internet, it’s been a while. I’ve been hard at work building web mapping tools for NYC’s City Planners, and have recently started using Mapbox GL pretty heavily in our stack. Why? It’s fast, sleek, powerful, and beautiful (and Open Source!). But it’s not just a simple improvement on the Leaflet.js slippy maps we FOSS mappers have come to love over the years, it’s whole different approach to data management and styling. In this post I’ll cover the basics of getting started with this next generation web mapping library.

The GL in MapboxGL is for WebGL (Web Graphics Library). WebGL allows you to draw things onto a 2D/3D canvas in ways not previously possible without third-party plugins, and is now supported in all major web browsers. In Leaflet.js and “traditional” web mapping in general, the map is really just a carefully arranged collection of normal web content, mostly images and SVGs. With MapboxGL, everything is drawn client-side onto a WebGL canvas, which opens up a whole new world of interactions, views, and styling choices.
For a nice side-by-side comparison, I’ve produced the exact same map with the exact same data in both leaflet.js and mapbox-gl.js. Both maps were initialized with the same center and zoom, and both have a light basemap. I’ve added a simple geojson feature, a point for the location of Hess’ Triangle in Manhattan, my favorite microparcel, and styled it the same way in both maps (a circle, opacity 0.7, color steelblue, and radius 10)
Shame on me for not disabling scroll wheel zoom on these full-width web maps, but I need you to use your scroll wheel on the mapboxGL map!
Leaflet.js Map
Mapbox GL Map
Notice that the zoom control on the GL map has a little compass. If you click and drag to the left or right, you’ll see that the map can rotate 360 degrees, but the labels remain oriented properly! This is WebGL in action, it allows us to change the point of view, so north doesn’t always have to be up. If you drag up and down on the compass, you can change the pitch of the map up to 60 degrees off of vertical!
Probably more important than the rotation and pitch controls are the continuous zooming. By clicking the zoom control in MapboxGL, you’ll move from one fixed zoom level to the next, but notice that there is no “flash” or pixelation occurring as there is with the leaflet map. Mapbox GL doesn’t need to re-draw everything or go fetch new images like leaflet does, it just changes the camera position, and we get a very smooth, animated transition. If you use your scroll wheel, you can even make tiny incremental zoom adjustments and get your maps looking exactly the way you want them. (How many times have you wished your default leaflet map view was somewhere in between zoom levels? It happens to me all the time!)
My reaction when I got my first GL map working:
I am kind of loving mapbox gl right now
— Chris Whong (@chris_whong) August 19, 2016
Rendering GeoJSON Data
Here’s the code for the leaflet map above. L.geoJSON() is our friend that can consume a geoJSON object and accept some style rules. The syntax is a bit complex, as we are calling L.geoJSON() but also passing in an options object with pointToLayer defined. pointToLayer is a function that returns an L.circleMarker(), and it’s this that we finally add our style object to. Oh yeah, and then after all that, we still have to addTo(map).
MapboxGL treats data and styles independently as things called “sources” and layers”. Sources are data (geometries and associated properties) that are available to use in the map. Layers are the styling instructions and filters applied when actually rendering the data. Each layer must have a designated source, and many layers may use the same source. (Your labels will be a different layer than your markers, but both will use the same data)
To add geojson to the map in mapboxGL, we must first create a source using addSource(), giving the source a name. Once the source is added we then add one or more layers using addLayer(). We pass in the styling instructions here, and mapboxGL does its thing, rendering our geojson on the map. The styling documentation is great, and can be found here.
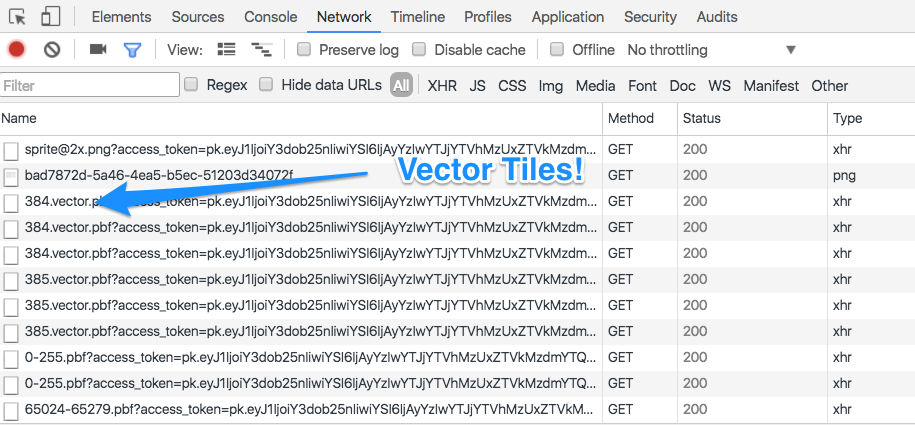
Notice that there was no separate chunk of code for adding a basemap like we had to do in the leaflet map. With mapboxGL, there is no notion of basemaps. Everything you see on the map – every road, park, label, coastline, etc – is vector data, rendered and styled in the browser using WebGL. When we initialize the map, we specify an initial style: ‘mapbox://styles/mapbox/light-v9’. Behind the scenes, mapbox is serving up vector tiles with OpenStreetMap data, and some very complex layer definitions that result in the lovely light basemap you see. There are actually 150 distinct layers being drawn on the map to produce mapbox’s ‘light-v9’ style, and all of their sources are super-compressed and packed into a each vector tile.
When we add geoJSON data, we are simply adding a new layer on top of the 150 that already existed on the map.
Some Other Notes
– MapboxGL likes things to be lngLat, while leaflet likes latLng.
– MapboxGL is so new, that a lot of the things you may want have not been built yet. It’s exciting and frustrating at the same time, and I find myself lurking in their github issue threads waiting for updates
– I was able to figure out how to consume Carto’s non-documented vector tiles in MapboxGL, and have an example here. (since updating to the newest version of mapboxGL, carto tiles are now throwing alerts because they are not v2 of the vector tile spec)
– You can also load regular old raster tiles in MapboxGL, however when you are between zoom levels you’ll get pixelation.
I suppose that’s it for now. I’m very excited to see where this library goes, and to start doing more fancy animations and flyTo()s in some of my projects. Let me know on twitter if you found this helpful or have any questions I can help out with. Happy next-generation mapping!
I wonder if anyone has started their own mapping company just so they could dictate the order of wgs84 coordinates. latLng vs. lngLat
— Chris Whong (@chris_whong) September 20, 2016
Leave a Reply