Building Urban Scratchoff
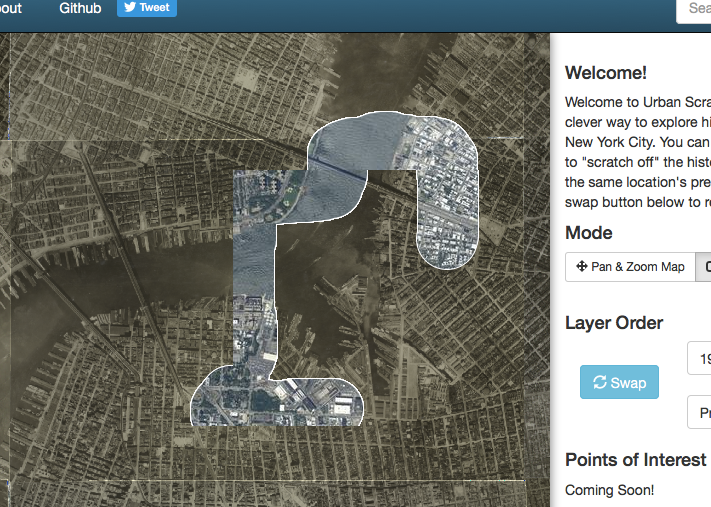
Last week, I shipped a just about finished version of Urban Scratchoff, a simple map app that lets you explore two different layers of NYC aerial photographs by “Scratching off” one to reveal the other. If you haven’t seen it, try it out now and come back. I’ll wait…
Pretty cool, right? Here’s how I came up with the idea, and some of the technology necessary to make it happen.
I am an urban car-owner (don’t hate), and I often find myself driving on the BQE, the Robert Moses-era urban highway that winds its way through Brooklyn and Queens. Some parts are elevated, some are set below-grade in a trench. It’s cuts through neighborhoods, leaving rusty pedestrian walkways and dimly-lit “under-the-bridge” dead spaces in its path. Near where I live, it joins with the entrance of the former Brooklyn-Battery tunnel (now the Carey Tunnel), and creates a massive elevated interchange that cuts off Red Hook from the rest of the city.
I wanted to see what was there before the highway… As with the saga of Hess’ Triangle, I’m always interested in the scars left on the built environment by interruptions to street grids, widening of roads, landfill into water, etc. However, I didn’t just want to study historic aerials and maps. The idea popped into my head that it would be really interesting to “erase” the pre-BQE blocks on a historic photo to reveal the modern highway and get a better idea of the cost of progress. To be honest, it reminded me of SimCity, where you can demolish whole swaths of land with a click of a mouse. This would be much more than just comparing two aerial images of the same place… it would let the user choose an area to explore, and reveal the differences at their own speed, based on their own curiosity.
Finding Historical Aerial Photos
I was going to need orthorectified pre-1930s aerial photos of New York, or at least Brooklyn. (orthorectification is the process of skewing an image so that it aligns with a coordinate system. If you want your aerial photo to align with a basemap, you must orthorectify it!) I prepared myself for the long and arduous task of finding high-resolution scans of aerials and figuring out how to turn them into rectified geoTIFFs and eventually into an xyz tile set that I could use as a layer in leaflet.js. This was going to suck, but it was the dirty work that had to be done before amazing web things can be made. (Much like munging of data before visualizing or mapping it, this is where I had planned to spend most of my time) I took to the twittersphere where there are other urbanist map nerds just waiting patiently for people to ask questions like this:
Hey NYC Map Tweeps, where can I get good pre-BQE aerial photos of Brooklyn? @SR_spatial @riordan
— Chris Whong (@chris_whong) December 2, 2015
@riordan @SR_spatial @nypl Need something overlay-able on a web map
— Chris Whong (@chris_whong) December 2, 2015
@riordan @SR_spatial @NYPLMaps Awwww, yiss. Thank you sir
— Chris Whong (@chris_whong) December 2, 2015
NYPL Labs veteran and fellow map techie Dave Riordan pointed me to the New York Public Library’s MapWarper Site, which is…
…drumroll please…
A CROWD-SOURCED IMAGERY AND MAP ORTHORECTIFICATION PLATFORM FULL OF HIGH-QUALITY SCANS OF 1924 AERIALS OF THE ENTIRE CITY WHICH ALSO SERVES XZY TILES, WMS, AND HAS MANY OTHER OUTPUT FORMATS!
I don’t know if there’s a term for this, other than “F–KING SWEET”, but it’s that thing that happens when you find out someone has done what you were about to spend hours (weeks) working on, and they shared their results so you can use them in your project. Usually, it’s code you find on github. In the case of mapwarper, it’s rectified aerial imagery at whatever zoom level I want, for the whole damn city, served up as tiles that I can layer in a web map with a single line of javascript. I can’t stress this enough: Ask the internet before you take on something big, you never know what kind of amazing help you’ll find.
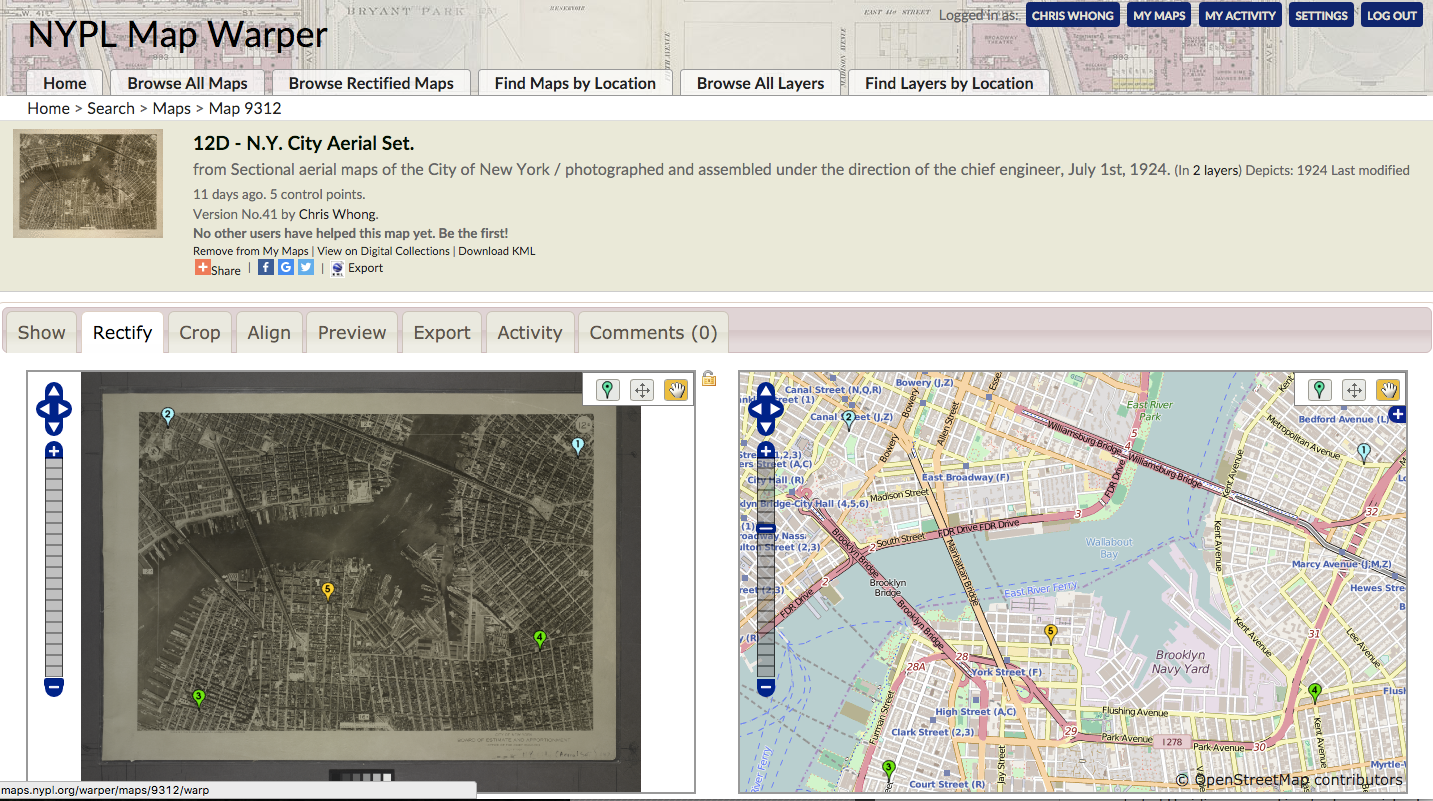
How MapWarper Works
NYPL Labs’ MapWarper is based on Tim Waters’ MapWarper project, an open source web app that allows anyone to create an account and help rectify scans of maps and aerial photos. The library has scanned in hundreds of old maps, and anyone, including you, can login and contribute. I spend a couple of evenings adding more control points to the aerials over Brooklyn to build the proof of concept that would become Urban Scratchoff, and it’s quite fun. You have to find corresponding points on the historic imagery and a modern-day basemap, and with aerial photos that don’t have any labels, that means searching for spatial patterns, landmarks, intersections, and building footprints.
Seriously, you can help out… any place on Urban Scratchoff where the streets don’t quite line up is in need of more accurate control points. You can sign to NYPL Mapwarper and improve the tileset.
Finding Modern-day Aerials
Leaflet Providers is a great resource that catalogs tile layers from around the web that are usable in leaflet.js. Most are basemaps by the likes of Mapbox, HERE, ESRI, Stamen, and my employer, CartoDB. There are a few satellite imagery layers, and the one I chose to use is Mapquest’s Open.Aerial. Here’s a big thanks to them, and everyone else who makes these layers free to use in web mapping projects!
The Fun Stuff: Figuring out how to “Scratchoff” an image using 2015 web technologies
The task at hand was to layer two images on top of each other, and to somehow erase parts of the top layer, allowing the bottom layer to show through. Layering things on web pages is easy, and so is hiding and showing them on command with a little bit of javascript. But hiding arbitrary user-drawn chunks of one layer? I knew HTML5 Canvas was the answer, but I had no idea how to get there. To the googles!
Oh look, a jsfiddle called Canvas Eraser that does exactly what I want. Drag your mouse along the gray box below to erase parts of it, revealing an image.
For those who have never tinkered with it, HTML Canvas is a drawing API that you can use draw arbitrary shapes, colors and patterns into part of a website. CartoDB’s animated torque maps make use of canvas, and its a great way to visualize large amounts of data because the browser doesn’t have to remember the details about everything it draws. You have to be very specific about what you want to draw, (it actually reminds me a bit of drawing using Apple’s low resolution graphics back in the 80’s – I actually have an example of this on github), “I want a circle, with this fill color, this transparency, this stroke color, this width, this diameter, starting at this x/y coordinate… go!”
The magic that is happening here is the destination-out composite operation, which turns the shape you’re drawing transparent instead of filling it with a color. For more on the composite operations available in canvas, check out this handy Mozilla reference.
Finding the above “canvas eraser” fiddle was a Eureka moment, (again, don’t you love it when someone else has already done what you were going to spend a lot of time on and shared their work? It’s a great time to be alive and coding) and the next task was to shove this functionality into Leaflet.
My first experiment made use of CanvasLayer, a plugin for leaflet (by CartoDB) that creates an empty HTML canvas with the same dimensions as the leaflet map, and some helper methods that you can use to trigger a re-draw when the user pans or zooms the map. You can see it in action in this block:
The author of the above block could have used leaflet’s built-in SVG circlemarkers or a D3.js overlay to draw all those points on the map, but Canvas lets them do it without choking out the browser. Drag the map, the canvas erases and re-renders, and there’s no need to keep everything in memory.
The canvas overlay worked with a static image I had downloaded from NYPL mapwarper. I loaded the modern imagery as a normal Leaflet TileLayer, and added the historic image as a canvas overlay. I was able to reposition the image when the user dragged the map, but it was clunky. Because the canvas overlay was exactly the same dimensions as the map, there was no imagery in the buffer area around the map. When dragging, the user would just see the bottom layer around the edges until the canvas finished re-drawing. The scratchoff functionality worked as expected, but once the user panned the map, the canvas would re-render and the scratched-off chunks would disappear. I needed another solution.
Perusing the leaflet docs (a favorite pastime of geo-dorks. Seriously, ask one), I stumbled across TileLayer.canvas. Instead of one big canvas element, it places many 256×256 pixel canvases on the map where normal tile images would go! This solves a lot of the grunt work, as leaflet automatically requests tiles around the fringes of the current mapview to make a more seamless panning and zooming experience. When leaflet loads an empty canvas tile, I just figure out the x/y/z coordinates of that tile, request the corresponding 1924 aerial tile, and then draw the imagery tile into the canvas element using canvas’ drawImage() method.
  //add top (canvas tile) layer
  canvasTiles = L.tileLayer.canvas({tileSize:256,unloadInvisibleTiles:true});
  canvasTiles.drawTile = function(canvas, tilePoint, zoom) {
    var ctx = canvas.getContext('2d');
    var img = new Image()


    img.src = Mustache.render(topLayer.url.replace(/{/g, '{{').replace(/}/g,'}}'),{
      z: zoom,
      x:tilePoint.x,
      y:tilePoint.y
    })
    img.onload = function() {
      ctx.drawImage(img,0,0);
    };
  };
  canvasTiles.addTo(map);
This method worked like a charm, but left me with an edge problem. I could sense which canvas tile the user was dragging their mouse in and use the destination-out trick to erase part of it, but when the mouse was near the edge of a canvas I would need to draw in two canvases at the same time. The edge problem looked like this:
I solved this by checking if the cursor was near the edge of a tile during the drag. If it was, I selected all 8 neighboring tiles and simultaneously drew the same destination-out circle into all of them. This allowed for a seamless scratchoff across tile boundaries. It has been brought to my attention that my fix only worked in Chrome and that the edge problem still shows up in Firefox and Safari. I need help on this one.
The Right Thing to Do: Cache the Tiles
Urban Scratchoff is currently running on github pages, meaning it has zero server-side code. This is pretty rad, and is only possible because both of the tile layers I am using are freely available and hosted by others. Mapquest’s open aerial imagery layer was built for mass consumption, but NYPL’s mapwarper might not bear the burden if a lot of people started using Urban Scratchoff at the same time. I set up a tile cache using the aptly-named express-tile-cache package. The cache runs on a digitalocean droplet. You’ll see that the tile URL in use for the historic imagery is not an NYPL site, but my own domain lolspec.com:
var tileLayers = [
  {
    name: 'Present Day Aerials',
    url: 'http://otile1.mqcdn.com/tiles/1.0.0/sat/{z}/{x}/{y}.jpg'
  },
  {
    name: '1924 Aerials',
    url: 'http://tilecache.lolspec.com/tms/1924/{z}/{x}/{y}.png'
  }
];
When leaflet requests a tile from tilecache.lolspec.com, the node app checks to see if it has a saved copy of the tile on my sever. If it does, it serves the saved tile. If it does not, it grabs the tile *once* from NYPL mapwarper, serves to the client, and saves it in the cache. Every now and then I’ll wipe out the saved images so that Urban Scratchoff can benefit from updates that people are contributing to mapwarper.
Code for the tilecache is on github
Oh yeah, during the early hacking, I needed a small set of tiles to use locally, so I forked and improved this node-based tile downloader. Check it out if you ever need to download a tileset into an x/y/z folder/file structure.
TODO & Conclusion
So that’s my Canvas and Leaflet Saga, and the result is an addictive map toy for urbanists and historians. Every person that looks at Urban Scratchoff is drawn to a different part of the city that has some meaning for them. I’ve enjoyed looking over people’s shoulders as they explore the infill of Battery Park City, the world trade center site, the BQE and Gowanus Expressway, Ebbets Field, La Guardia Airport, Brooklyn Bridge Park, Marble Hill, and many more interesting NYC sites.
The next step will be to allow anyone to “mark-up” the map with interesting places to scratch along with text description of what’s there. I’ll probably use CartoDB to store and serve the data and leaflet.draw to let users create arbitrary points, lines and polygons on the map to share. If any coders out there want to help out with this, I’d love a hand.
Another todo will be to add more cities, and more options for imagery. Yet another one will be to link back to images on NYPL mapwarper so users can fix imagery on the spot. I would LOVE to see an NYC historian narrate in real-time as they scratch the map off… screencast it and put in on youtube! Do you know anyone willing to give this a shot?
Thanks for reading. The code for Urban Scratchoff is on github for you to fork for your city or contribute to. Happy mapping!
Leave a Reply