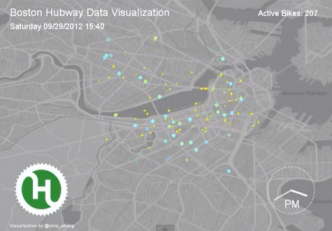
Visualizing the Boston Hubway Bikeshare
10,467 trips are shown, on a Wednesday through Sunday time period in late September 2012. Blue dots represent “starts”, where a person …

10,467 trips are shown, on a Wednesday through Sunday time period in late September 2012. Blue dots represent “starts”, where a person …
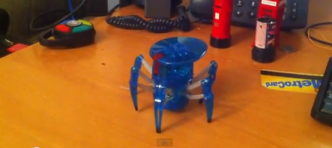
After success with the Arduino Air Conditioner Remote Control, and getting Pusher authentication and client events working from an Arduino, I was in search of …
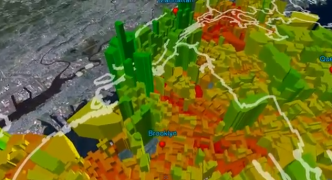
3D Animation showing extruded median income in New York City. Made with ArcGIS. Data: American Community Survey 2008-2011 3 year estimates.

It’s done. It works. The internet of things has come to my little apartment in New York City. After about a week …
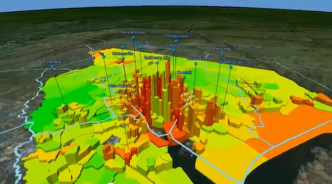
Made with ArcScene and U.S. Census Data. Density is represented by elevation, Median Income is represented by color (red = lowest and …