Reinvent Transit
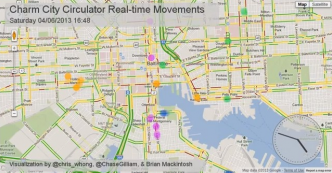
Betamore hosted a transportation hackathon in Baltimore this weekend by the name of Reinvent Transit. Like any good displaced Baltimorean who is …
Betamore hosted a transportation hackathon in Baltimore this weekend by the name of Reinvent Transit. Like any good displaced Baltimorean who is …
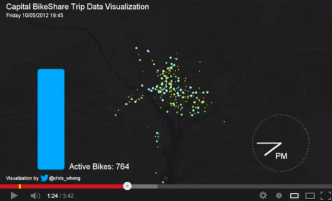
This animation shows over 32,000 trips on the Capital Bikeshare from October 4-8 2012. (Wednesday-Sunday) Data available here: http://www.capitalbikeshare.com/trip-history-data. Blue dots are …
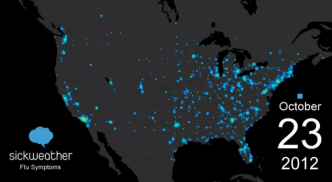
This data visualization was created for sickweather.com, and shows reports of Flu as a heatmap in the United States from October 2012 …
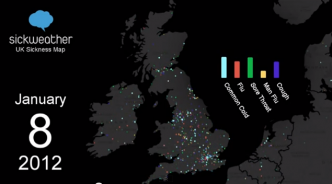
This data visualization was created for sickweather.com, and shows reports of sickness in the UK from December 2011 through May 2012. Visualization …
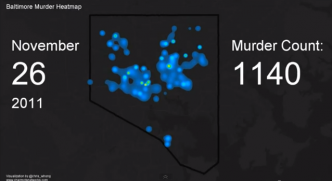
This video shows a heatmap animation of homicides in Baltimore City from January 2007 through September 2012. Each incident adds heat which …
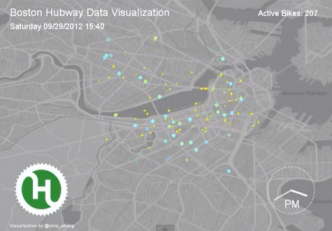
10,467 trips are shown, on a Wednesday through Sunday time period in late September 2012. Blue dots represent “starts”, where a person …
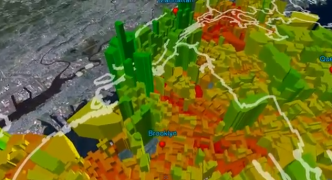
3D Animation showing extruded median income in New York City. Made with ArcGIS. Data: American Community Survey 2008-2011 3 year estimates.
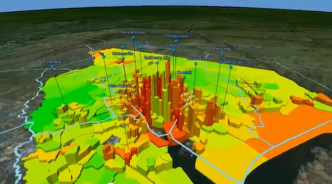
Made with ArcScene and U.S. Census Data. Density is represented by elevation, Median Income is represented by color (red = lowest and …