An Experimental Twist on the D3 Bubble Chart
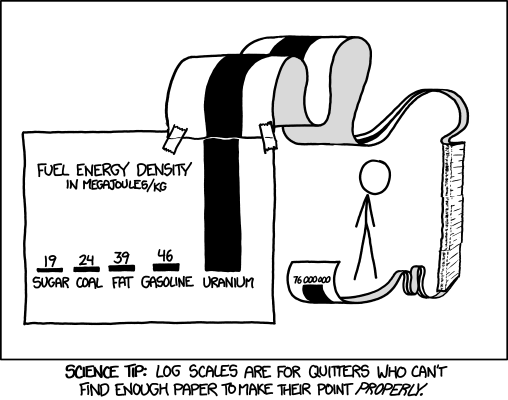
Recently I was playing with charting some data that has a very large range of values, and some outliers with REALLY large values relative to the rest. This XKCD article came up when searching for ways to visualize data with this kind of range disparity.
Log scales were a common answer, but I ended up looking to the old D3.js force-directed bubble chart. I’ve made one of these before, showing NYC’s FY2013 adopted budget by agency, but I was just shoving my data into someone else’s open-sourced visualization.
To be more specific, I was following Jim Vallandingham’s tutorial on building bubble charts, which was written and shared entirely in coffeescript. I knew just enough to be dangerous and tweak some variables in his code and get it to read my input CSV, but at the time I didn’t have the skills necessary to really modify it that much.
These days I can do a lot more, so I decided to convert everything in his tutorial into regular old javascript so I could play around with the bubbles. (I also added some bit from this great fiddle by Andy Cooper) I wanted to add some interactivity that would highlight a bubble AND separate it from its neighbors (hover over the items in the sidebar and see the corresponding bubble turn red and isolate itself):
View fullscreen on github pages
This is achieved by going through the nodes array that the bubbles are based on, and changing the data element that affects the bubble’s charge in the D3 force layout.
//when mousing over a sidebar item, find its match in the nodes array and add 40 to its charge
 $('div[class^=agency]').mouseover(function(){
      var thisClass = $(this).attr('class');
      d3.select('circle.' + thisClass).attr('class','highlight ' + thisClass)
        .transition().duration(250).style('fill','red');
        var thisAgency = $(this).html();
        nodes.forEach(function(d){
          if(d.organization == thisAgency) {
            d.charge = d.radius + 40;
          }
        });
        force.start();
A similar function returns the charge to its normal value on mouseout.
I am sill not sure if I’ll ever use this technique, but I wanted to share it for feedback and so others can build on it if they like.
Code on github: http://www.github.com/chriswhong/
Leave a Reply