This Ugly Map Got a Lot of Attention Today
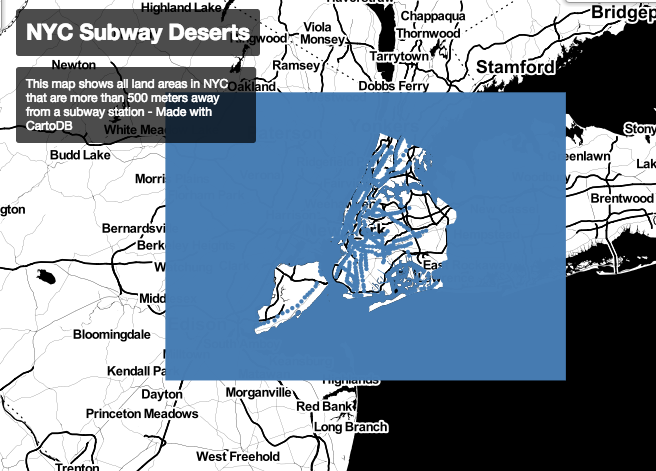
Be careful what you release into the wilds of the internet! A few days ago, mostly out of curiosity, I created the following map, showing “subway deserts” in New York City:
The concept was to turn the areas near subways into negative space, and see what the remaining land areas looked like. I spent maybe 30 minutes on it on Monday, tried a few different basemaps, made the buffers match the water, admired it for 30 seconds, and fired off a tweet about how the remaining areas look like little islands.
Last night, a friend sent me a link showing that CurbedNY had written a piece on it. Today, it showed up in CityLab, Gothamist, and Google Maps Mania, and also has a little thread on r/nyc. This was concerning, as it just isn’t a very good map, but I left it public on my CartoDB account and now it was out there. I considered sprucing it up after I started to see the activity on twitter, but in the end I thought it best to leave it the way it was when they wrote about it, and let people say what they are going to say.
The comments sections have some interesting transit debates, and a lot of discussion about my choice to set the buffers at 500 meters. Truth be told, I tried a few distances between 400 m and 800m to see what they would look like, and 500 happened to be the last one I tried before I moved on to other work. I concede, a 6 minute walk to the subway doesn’t constitute a transit desert. I concede, it’s not the prettiest web map ever made, but as a concept it was successful in showing the “leftover” chunks of land that are distant from subway stops.
If you’re a map nerd, read on to learn how it was built. Warning: PostGIS
To make this map, I basically needed to make a mask through which some parts of the basemap would be visible. If you zoom out far enough, you’ll see that the blue background is just a big rectangle drawn over the New York Metro Area.
ST_MakeEnvelope(-74.5, 40.4, -73.4, 41, 4326)
Just using ST_MakeEnvelope() would result in a rectangle, but I needed to cut a New York City-shaped hole out of it. Using the department of City Planning’s boroughs shapefile, I was able to run a symmetrical difference to slice out the city’s boundaries from the rectangle. ST_Collect() combines the polygons for the 5 boroughs into one MultiPolygon, and then ST_SymDifference() returns the areas of the rectangle and the collected boroughs that do not overlap.
The finished query for that layer is below:
WITH nyc AS (
  SELECT a.the_geom
  FROM   (
    SELECT St_collect(the_geom)
    AS the_geom
    FROM   ny_boroughs
  ) AS a
)

SELECT ST_Transform(
  ST_Symdifference(
    ST_Makeenvelope(
      -74.5, 40.4, -73.4, 41, 4326
    ),
    nyc.the_geom
  ), 3857
) AS the_geom_webmercator
FROM nyc
To buffer the subway stops, I used Steve Romalewski’s trusty shapefiles, extracted from NYC’s GTFS data. Using the same technique I outlined in this CartoDB blog post, I use ST_Buffer() and ST_Union() to generate 500 meter buffer polygons around each subway stop, and then combine them all into a single polygon.
SELECT
ST_Transform(
  ST_Union(
    ST_Buffer(
      the_geom::geography,
      500
    )::geometry
  ),
  3857
) as the_geom_webmercator
FROM nyctsubwaystops_100627_curcleaned
The ST_Transform() is necessary to get the data from WGS84, the coordinate system it lives in inside the database, into Web Mercator, the coordinate system CartoDB uses to map it.
Finally, color the buffers the same as the background rectangle, and the only pieces of the basemap that show are those that are within NYC’s borders but farther than 500m from a subway stop.
Thanks for reading!
Leave a Reply