Anatomy of a Civic Hack: Freeing Baltimore’s Real-time Bus Data
This morning, the appropriately named transit app TransitApp released a blog post on medium, entitled “How we saved Baltimore $600,000 in one day“. In it is a tale of reverse engineering the Maryland MTA’s highly-criticized and terribly clunky real-time bus locator app. It’s a web app, and to quote the authors of the medium post, it “is treating its users to an interface that looks like it was ripped from a 1996 GeoCities template.” A tweet from an angry critic read:
“MTA hired the finest transit techs from 1989 Albania. This system might win 3rd place in a 5th grade science fair.” http://t.co/hjR5osZla9
— Mark Dziubek-Brown (@CarFreeDallas) February 12, 2015
It’s bad, and what’s worse is that the treasure trove of real-time vehicle locations that powers it is not accessible for third parties to develop on. This is what open data is all about. When governments release apps and not data, citizens get only one option to consume the information. If it sucks, it sucks. Write your congressman. When governments release data, they get many apps… and maps, and research, and analysis, and *gasp* real transparency. Who builds these apps and maps? Anyone. That’s the point. It can be me and my fellow civic hackers building simple tools in our free time, or it can be a legitimate and popular mobile transit app like TransitApp. Open data is the raw material, and governments should be wholesaling it, not locking it up behind clunky frontends. For more on open data and its possibilities, I highly recommend this amazing TEDx talk by my friend and fellow NYC open data geek, Ben Wellington.
I digress… this post is titled “Anatomy of a Civic Hack”, so let’s get down to it. I want to break down what it really meant to “decipher” the real-time data feed that powers the MTA’s bus app and to do some coding that put it to use as a proof of concept.
This all started when someone posted this Baltimore Brew Article about the MTA’s bus tracker app in the Baltimore Transit Facebook Group. “Still scratching your head?” it asks of Baltimore straphangers, many of whom had used the beta app and found themselves wanting and waiting. A discussion ensued about how the raw data was not available, and that representatives from the MTA had stated that it would cost $600,000 to pay a vendor to build a publicly accessible real-time data feed. Challenge accepted.
If the MTA’s app was able to display vehicle locations on a google map, and list estimated and scheduled arrival times in your browser window, that data has to be coming across the wire from somewhere. It could be baked into the page, or it could be coming in after the fact via an Ajax call. One way or another, data representing the location of the bus is arriving on your local computer.
The task at hand was to figure out how this process was taking place. I fired up a route’s real-time view and opened up Chrome’s network traffic inspector to see if I could watch the real-time updates coming over the wire.
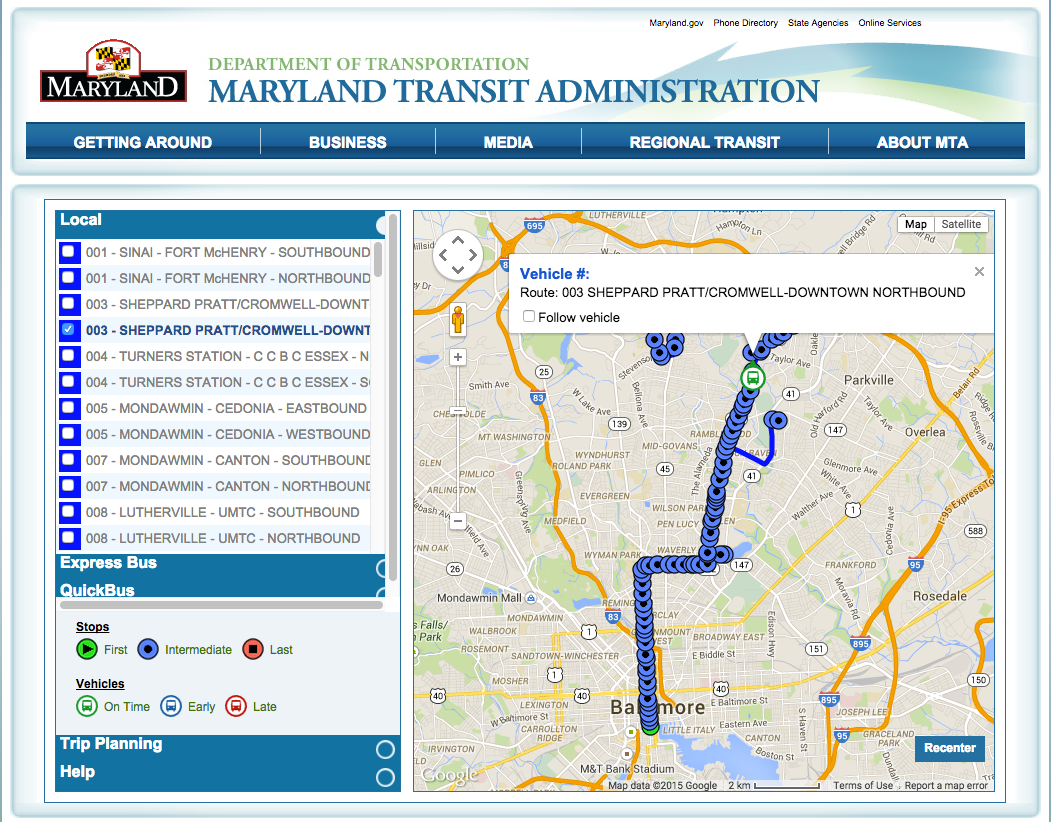
After sitting on the page for a while, I noticed an HTTP POST happening every 10 seconds or so after I selected a route to view on the map. This means the page is requesting data from the server on regular intervals, so the response inside this POST request must contain the data that’s being used to move the vehicle around on the map.

Chrome’s network traffic inspector also allows you to view the contents of the network traffic coming into your web browser. The results of these POSTs were text in a format called JSON, a popular structured data format.
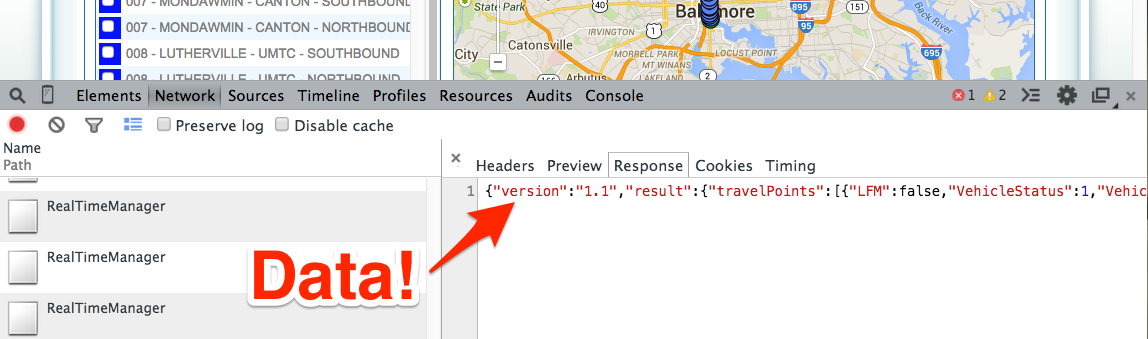
The full response from one of these POSTs is shown below:
{
  "version":"1.1",
  "result":{
    "travelPoints":[
      {
        "LFM":false,
        "VehicleStatus":1,
        "VehicleNumber":"",
        "VehicleId":0,
        "BlockId":257486,
        "ESchA":0,
        "EstimatedPoints":[
          {
            "Time":76454,
            "Lon":-76.563764,
            "Lat":39.397156,
            "Heading":247.456938999942,
            "LineDirId":73801,
            "TripId":1533820
          },
          {
            "Time":76455,
            "Lon":-76.563816,
            "Lat":39.39714,
            "Heading":247.456938999942,
            "LineDirId":73801,
            "TripId":1533820
          },
          {
            "Time":76456,
            "Lon":-76.563869,
            "Lat":39.397123,
            "Heading":247.456938999942,
            "LineDirId":73801,
            "TripId":1533820
          },
          {
            "Time":76457,
            "Lon":-76.563921,
            "Lat":39.397107,
            "Heading":247.456938999942,
            "LineDirId":73801,
            "TripId":1533820
          },
          {
            "Time":76458,
            "Lon":-76.56401,
            "Lat":39.39708,
            "Heading":251.565051177078,
            "LineDirId":73801,
            "TripId":1533820
          },
          {
            "Time":76459,
            "Lon":-76.564064,
            "Lat":39.397065,
            "Heading":251.565051177078,
            "LineDirId":73801,
            "TripId":1533820
          },
          {
            "Time":76460,
            "Lon":-76.564119,
            "Lat":39.397051,
            "Heading":251.565051177078,
            "LineDirId":73801,
            "TripId":1533820
          },
          {
            "Time":76461,
            "Lon":-76.564174,
            "Lat":39.397037,
            "Heading":251.565051177078,
            "LineDirId":73801,
            "TripId":1533820
          },
          {
            "Time":76462,
            "Lon":-76.564229,
            "Lat":39.397022,
            "Heading":251.565051177078,
            "LineDirId":73801,
            "TripId":1533820
          },
          {
            "Time":76463,
            "Lon":-76.564284,
            "Lat":39.397008,
            "Heading":251.565051177078,
            "LineDirId":73801,
            "TripId":1533820
          }
        ],
        "LineId":7380,
        "LineDirId":73801,
        "TripId":1533820,
        "PatternId":82706
      },
      {
        "LFM":false,
        "VehicleStatus":0,
        "VehicleNumber":"",
        "VehicleId":0,
        "BlockId":257507,
        "ESchA":-9999,
        "LineId":7380,
        "LineDirId":73801,
        "TripId":1533821,
        "PatternId":82708,
        "ScheduledPoints":[
          {
            "Time":76454,
            "Lon":-76.617608,
            "Lat":39.327406,
            "Heading":356.153969909953,
            "LineDirId":73801,
            "TripId":1533821
          },
          {
            "Time":76455,
            "Lon":-76.617611,
            "Lat":39.327453,
            "Heading":356.153969909953,
            "LineDirId":73801,
            "TripId":1533821
          },
          {
            "Time":76456,
            "Lon":-76.617615,
            "Lat":39.3275,
            "Heading":356.153969909953,
            "LineDirId":73801,
            "TripId":1533821
          },
          {
            "Time":76457,
            "Lon":-76.617618,
            "Lat":39.327547,
            "Heading":356.153969909953,
            "LineDirId":73801,
            "TripId":1533821
          },
          {
            "Time":76458,
            "Lon":-76.617622,
            "Lat":39.327594,
            "Heading":356.153969909953,
            "LineDirId":73801,
            "TripId":1533821
          },
          {
            "Time":76459,
            "Lon":-76.617625,
            "Lat":39.327641,
            "Heading":356.153969909953,
            "LineDirId":73801,
            "TripId":1533821
          },
          {
            "Time":76460,
            "Lon":-76.617629,
            "Lat":39.327688,
            "Heading":356.153969909953,
            "LineDirId":73801,
            "TripId":1533821
          },
          {
            "Time":76461,
            "Lon":-76.617632,
            "Lat":39.327735,
            "Heading":356.153969909953,
            "LineDirId":73801,
            "TripId":1533821
          },
          {
            "Time":76462,
            "Lon":-76.617636,
            "Lat":39.327782,
            "Heading":356.153969909953,
            "LineDirId":73801,
            "TripId":1533821
          },
          {
            "Time":76463,
            "Lon":-76.617639,
            "Lat":39.327829,
            "Heading":356.153969909953,
            "LineDirId":73801,
            "TripId":1533821
          }
        ]
      }
    ]
  }
}
I see times, Latitudes, and Longitudes in there! But what does the rest of it mean? Why is it structured this way? Knowing that there are 86400 seconds in a day, I was able to infer that the Time stamp was the number of seconds since midnight. In the last entry in the above JSON, 76,463 seconds equals 21 hours,14 minutes, and 23 seconds, or 9:14pm (which is when I did these screen grabs). Try it for yourself using this nifty unit converter.
Lat, lon, and heading are pretty self-explanatory. LineDirId? This is the route_id from the GTFS data! A GTFS route ID is 4 digits, and the direction a bus is moving along the route is indicated by a 0 or a 1. So, in the last item in the above data, 73801 means routeID 7380, direction 1.
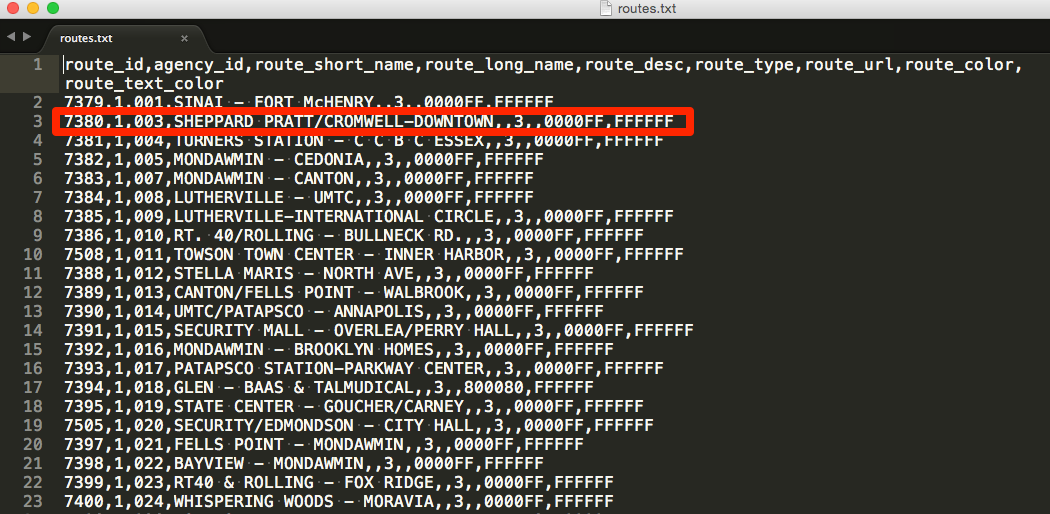
But how do we know what route 7380 is? We can look it up in the GTFS data! (GTFS is a data format that represents transit schedule information. Maryland MTA does release this data, and you can download it here and open it in a text editor.) I opened up routes.txt and route 7380 is right there waiting for me, confirming that this data supports the number 3 bus which I had selected on the map.
Further analyzing the results, there are two main arrays with results, one called EstimatedPoints, and one called SchedulePoints. You can see that all of the results under EstimatedPoints have the same TripId and LineDirId, but different lat/lon and times. Digging even deeper, you can see that the timestamps increment by 1 second, so what you’re looking at is the estimated of the vehicle over the next 10 seconds, which is all the app needs to animate the bus marker until the next batch of data comes in.
Phew! I am simplifying here a bit, and this process took hours of trial and error to confirm that the times were accurate, and to figure out which parts of the data corresponded to what was displayed on the screen, but it was beginning to make sense.
The next challenge was to figure out how the MTA’s app was requesting this data. An HTTP POST (as opposed to other verbs like GET) requires a payload that contains information about what the browser is requesting. Back to the chrome inspector! We can inspect the Request Payload and see what the browser is asking for.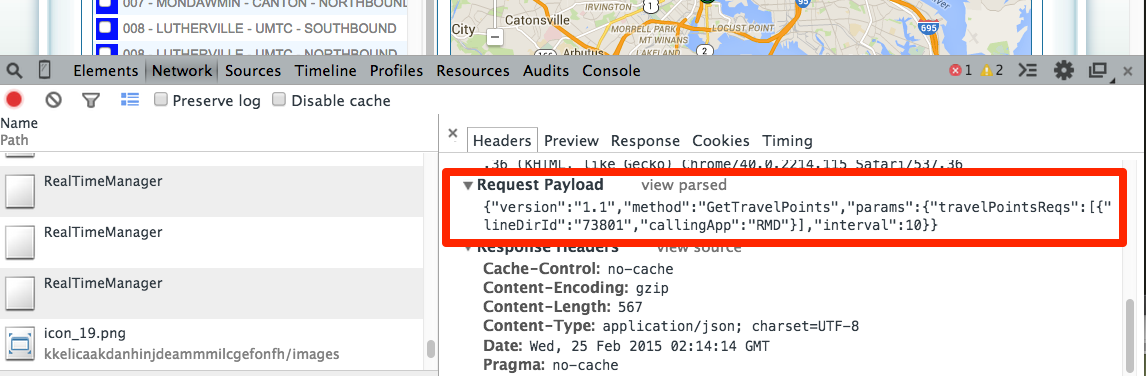
Let’s pretty that up and take a look:
{
  "version":"1.1",
  "method":"GetTravelPoints",
  "params":{
    "travelPointsReqs":[
      {
        "lineDirId":"73801",
        "callingApp":"RMD"
      }
    ],
    "interval":10
  }
}
So we’re using a method called GetTravelPoints, and passing it a few parameters. The most important is our lineDirId, which we already know represents the #3 bus northbound. The interval of 10 is what gets us the next 10 seconds of estimated vehicle locations.
Here’s where it got interesting. If you try to select more than two routes to display real-time data for on the map, you get an alert:
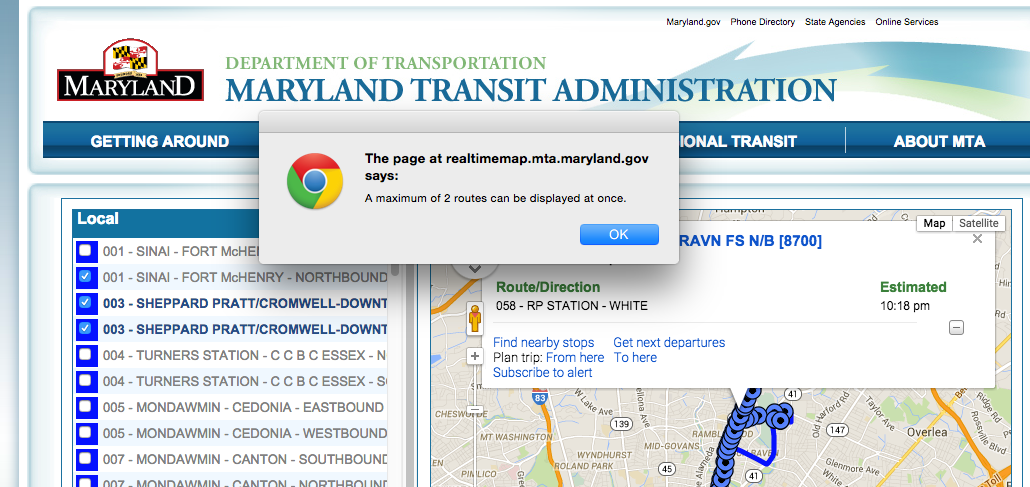
But when you inspect the request with two routes selected, here’s what you see in the payload:
{
  "version":"1.1",
  "method":"GetTravelPoints",
  "params":{
    "travelPointsReqs":[
      {
        "lineDirId":"73800",
        "callingApp":"RMD"
      },
      {
        "lineDirId":"73801",
        "callingApp":"RMD"
      }
    ],
    "interval":10
  }
}
What’s this? Two lineDirIds? Could I pass it 3 even if the app doesn’t allow it? Could I pass it 10? Could I pass it all of the routes in the whole system? The answer is yes, to all, and that’s exactly what we did.
I wrote a little node app that would grab real-time data for all of the routes, extract the latitude and longitude and then display the results on a simple leaflet map. Fellow Baltimore Civic Hackers and Data Nerds Shea Frederick and Elliott Plack joined in and we got to building a proof of concept. It wasn’t much, just lines for each route and dots for each bit of real-time data. It looked something like this:
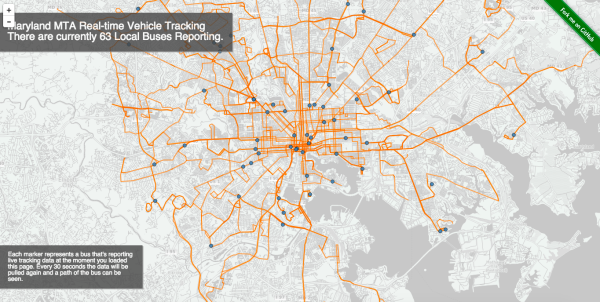
It’s not terribly useful, but it did show that we could make sense of the data and consume it outside of the MTA’s bus tracking app.
We’ve since added some more interactivity, and hope to make this an “accountability page” that can show historical timeliness of buses on each route and maybe even generate a “scorecard” of sorts, all backed by data of course. You can take a look at it live here.
![]()
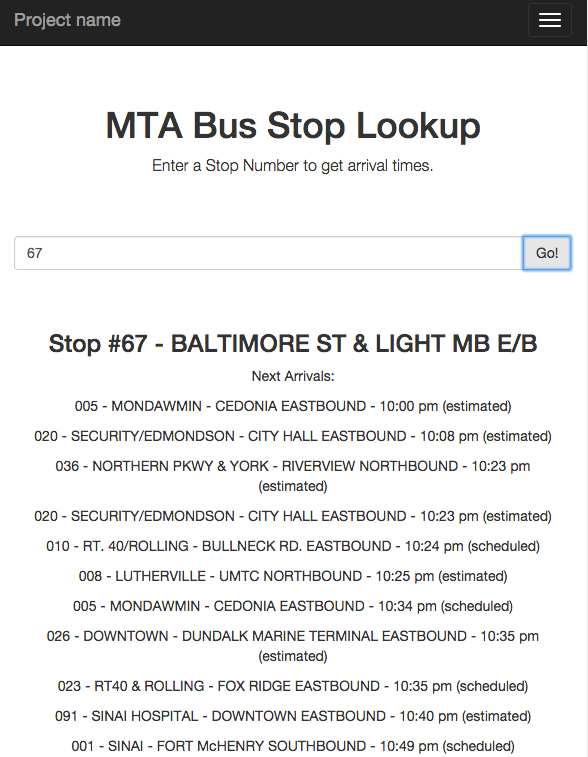
We also built a rudimentary stop lookup tool. This could become its own full-fledged app someday soon, but for now it allows you to enter a stop number and see upcoming arrivals. (Stop numbers are posted on a sign on the bus stop pole, so this is intended for use by transit riders. Now that TransitApp has so amazingly started consuming this data in their app, we don’t necessarily need to build our own. However, as I mentioned before, access to the raw data means there will be as many apps as people want to build, and the public gets choices. Web apps, native iphone apps, native android apps, etc… the sky is the limit!
Thanks for reading. You can check out the github repository for this project here: https://github.com/chriswhong/mtaMarylandBusTracking
Here’s some more press about TransitApp launching Baltimore’s real-time data in their app:
The Baltimore Sun – MTA real-time bus data ‘hacked,’ offered on private mobile application
Baltimore CityPaper – A developer created a mobile app for MTA riders, saving the transportation agency half a million dollars
Technically Baltimore – Thanks to civic hackers, a Montreal company just made Baltimore’s bus system more usable
Ars Technica – Bus pass: Civic hackers open transit data MTA said would cost too much to share
Government Technology – Maryland Transit Administration’s Real-Time Bus Data ‘Hacked,’ Offered on Private Mobile Application
TransitWire – Developers take Maryland bus tracker to next level
Baltimore Brew – Hacker’s bustracker map frees the data needed to hold the MTA accountable
Leave a Reply