Should I Stay or Should I Go? NYC Taxis at the Airport
For the past year or so, I’ve ditched the lines at the airport taxi stands and taken an Uber. I compare the situation to driving with an EZ-pass and seeing dozens of cars lined up in the cash lanes (I don’t think cash should even be an option for paying tolls, but that’s another blog post).
My last arrival at JFK Airport prompted some questions about the taxi stands, and the 2013 trip data I FOILed could come in handy helping to answer them.
My first question: What is the demand for taxi pickups at any given time at JFK airport?
My thought was that we should be able to predict how many taxis are needed at a given taxi stand based on flight arrival information.
I ran the idea by the infamous Ben Wellington (of the also-infamous iQuantNY Blog), who suggested it might be more worthwhile to analyze how long taxis wait between dropoff and pickup at the airport. I got to thinking a bit more, and wondered how many taxis that drop off at the airport stick around to pick up another fare?
A Little Context
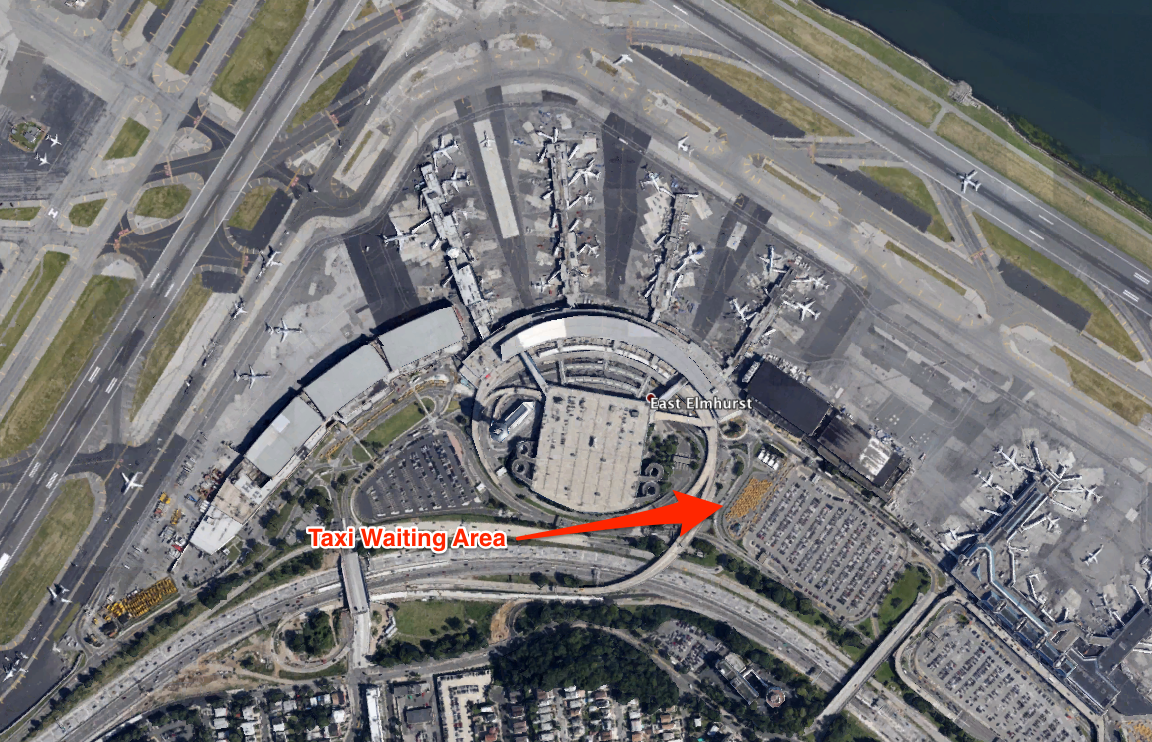
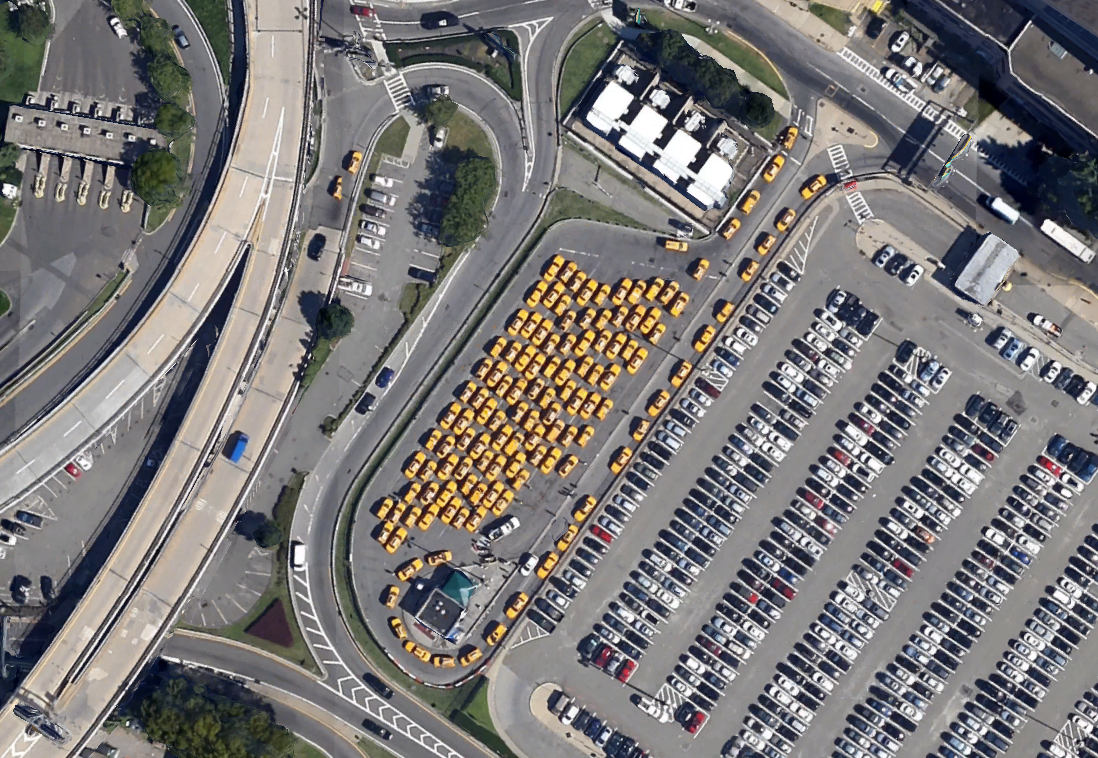
When a taxi drops off a passenger at the airport, they can’t just drive over to the taxi stand and get in line. They have to go to a taxi waiting area, where I am told they are dispatched as needed to the various taxi stands. Here are some Google Earth screengrabs showing where these waiting lots are located (thanks to my friend and former NYC cabbie Noel Hidalgo for pointing these out to me on the map):
At La Guardia:
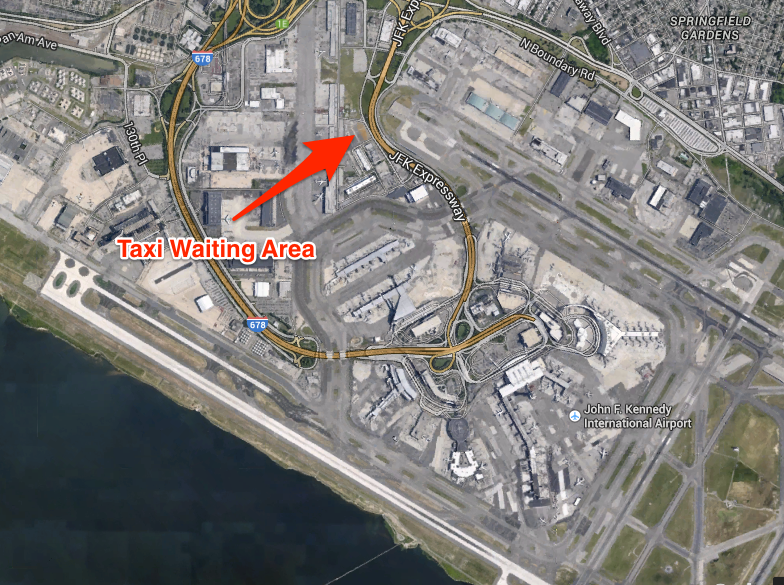
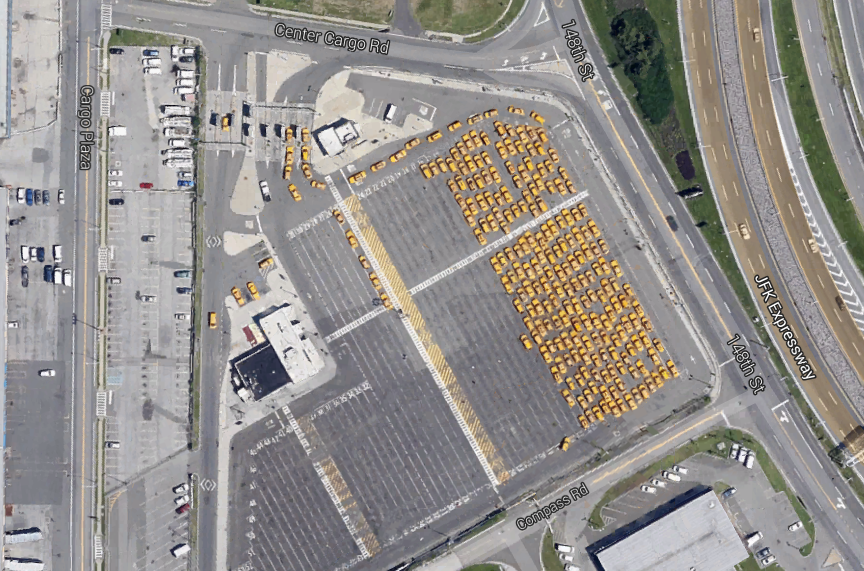
 …and at JFK:
To complicate things further, when a taxi picks up a passenger at an airport, they receive a little piece of paper that gives them the right to cut the line at these taxi waiting areas if their current fare is not going to Manhattan, Staten Island, or the Bronx. Basically, if your new airport pickup doesn’t get you back to Manhattan, you can come back to the airport over and over until you get one that does. (I am not sure if this is only at JFK, or if it is more complicated than this, so please correct me if I am wrong).
The Task at Hand
After mulling the questions around for a while, I figured it would be best to analyze a 24-hour period (A Day in the Life, if you will!) at one of New York’s airports (I chose JFK on an arbitrary Wednesday in May) and see what the patterns look like for taxi dropoffs. How many stick around waiting for another fare? How many bail and go elsewhere? How long do those that stick around wait? Next I needed some data.
Getting the Data
I figured out a good lat/lon bounding box for JFK airport and headed over to Google BigQuery, where the dataset sits for the world to analyze thanks to Google Engineer Jason Hall.
I was able to write a simple SQL query to get all trips that dropped off at JFK on a single day:
SELECT * FROM [833682135931:nyctaxi.trip_data]
WHERE DATE(pickup_datetime) = '2013-05-01'
  AND FLOAT(pickup_latitude) < 40.651381   AND FLOAT(pickup_latitude) > 40.640668
  AND FLOAT(pickup_longitude) < -73.776283   AND FLOAT(pickup_longitude) > -73.794694
This query worked like a charm, but it wasn’t quite enough. For every dropoff, I needed to know the time and location of its next pickup too. To the internet! Just like reddit helped me out with the complex query I needed for NYC Taxis: A Day in the Life, the StackOverflow community came to my rescue. Here’s my question, which was answered in under 24 hours and got me exactly what I needed using LEADs.
SELECT *
FROM
  (SELECT medallion,
       dropoff_datetime,
       dropoff_longitude,
       dropoff_latitude,
       LEAD(pickup_datetime, 1, "") OVER (PARTITION BY medallion
                                           ORDER BY pickup_datetime) AS next_datetime,
          LEAD(pickup_longitude, 1, "0.0") OVER (PARTITION BY medallion
                                           ORDER BY pickup_datetime) AS next_longitude,
          LEAD(pickup_latitude, 1, "0.0") OVER (PARTITION BY medallion
                                           ORDER BY pickup_datetime) AS next_latitude
   FROM [833682135931:nyctaxi.trip_data]) d
WHERE date(next_datetime)=date(dropoff_datetime)
  AND DATE(dropoff_datetime) = '2013-05-01'
  AND FLOAT(dropoff_latitude) < 40.651381   AND FLOAT(dropoff_latitude) > 40.640668
  AND FLOAT(dropoff_longitude) < -73.776283   AND FLOAT(dropoff_longitude) > -73.794694
The raw results look like this:
medallion,dropoff_datetime,dropoff_longitude,dropoff_latitude,next_datetime,next_longitude,next_latitude,nextAtAirport
57596C3BB33F47B02E57C56BEB9D540A,5/1/13 0:02,-73.790054,40.643394,5/1/13 8:36,-73.927505,40.763016,0
C8DF50155BF6D7C270502CB0F3B648F1,5/1/13 0:02,-73.78257,40.648788,5/1/13 2:34,-73.790825,40.646275,1
199645BE1D752AEF155DC36D00CCA269,5/1/13 0:14,-73.785492,40.648964,5/1/13 0:14,-73.783134,40.648556,1
04FDE702738ED4F1B032130E0F7202F3,5/1/13 0:16,-73.789993,40.643272,5/1/13 14:24,-73.964081,40.757504,0
...
Some High-Level Numbers
On Wednesday, May 1st, 2013, there were 2,774 taxi dropoffs at JFK Airport. 2,742 of these dropoffs had valid data for their next pickups, so this is the total used in this analysis. 1605 of these picked up their next fare at JFK, and 1137 picked up their next fare elsewhere. That’s 58.5% who chose to stick around.
I found it difficult to believe that 41% of taxis that dropped off at the airport would make the decision to leave the airport without a fare. Then I queried the pickups for the same day and was even more baffled. There were 7,812 of them! What’s up with that? Were there more arrivals than departures that day? Is this a seasonal trend? Why were there almost 3 times as many pickups that day as there were dropoffs? If there was such high demand, where did the 6200 cabs come from that did the rest of the pickups? A broader analysis is in order (and a killer animation I’m cooking up), but for now let’s stick to analyzing the dropoffs.
Edit 11/29/2014 9:30 am: After some simple mapping of the data, there appear to be a lot of “next pickups” that occur along the highway leaving the airport that are probably skewing the numbers a bit. I’ll have to figure out the best way to include these and see how much it changes the results. Read on with caution. The map below shows all of the “next pickups” for the cabs that dropped off at the airport on May 1st 2013. The ones that are not within the airport bounding box are shown in red. Notice the long trail extending to the northwest from the airport. These are probably airport pickups where the meter wasn’t started for a while (any other theories here, internet?)
Edit 11/29/2014 10:45 pm: I adjusted the analysis, map and charts to include those “next Pickups” that occur on the highways around the airport.
Digging Deeper: Hourly Analysis
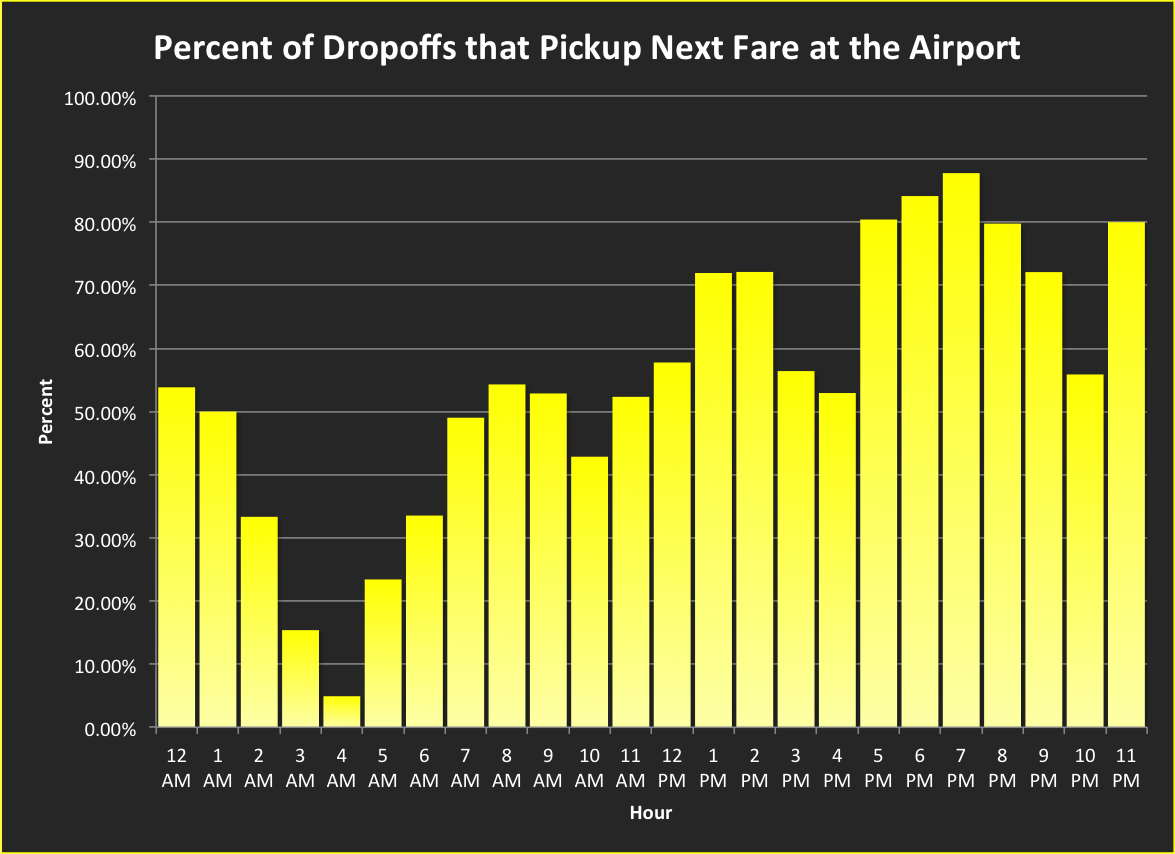
First, I dove a bit deeper into that 58% figure to see how it shook out by the hour. The chart below shows just that, and we can see that more cabbies chose to stay at the airport for another fare between 5 and 10 pm. The trend increases over the course of the day, with some clear peaks at 8am, 1-3pm, and 5-10pm.
*Remember, these charts show only a single day’s data, and I have not yet figured out if this day is typical.
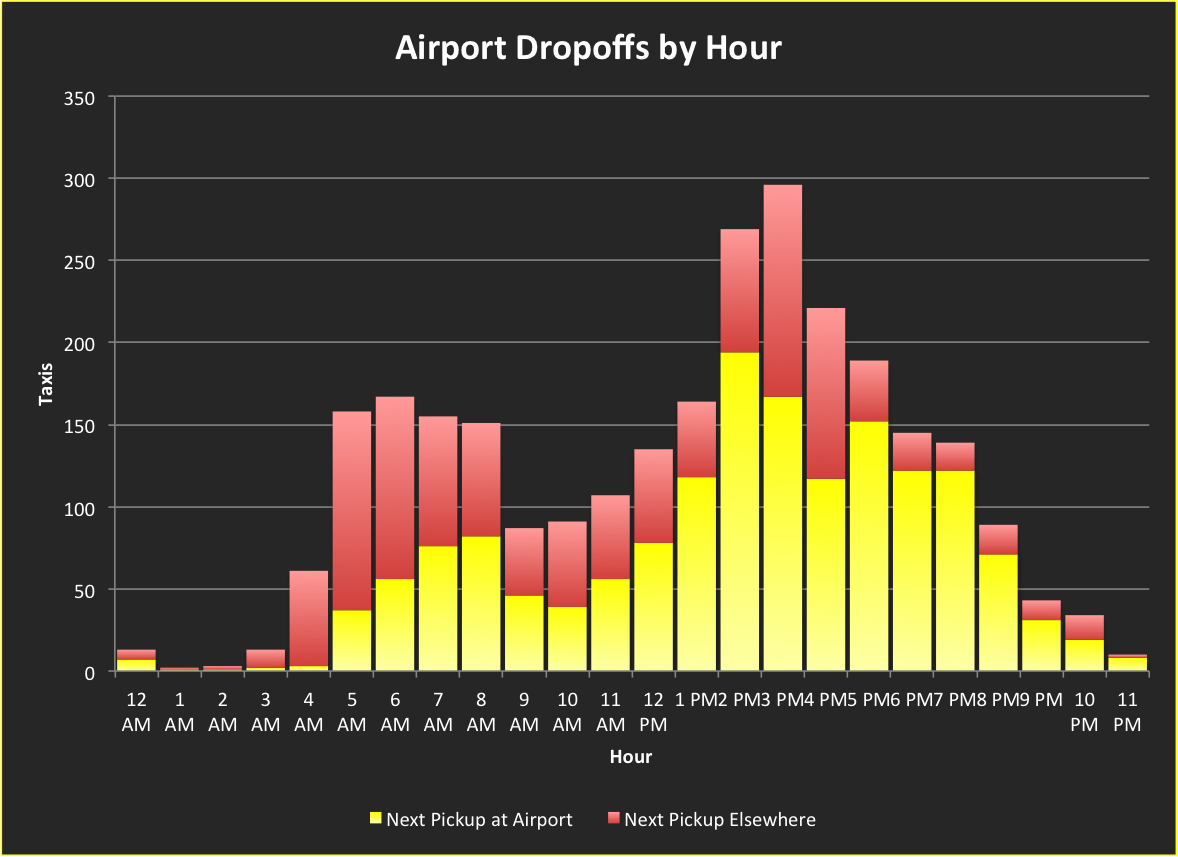
Here’s a stacked chart that shows actual volume of dropoffs by hour. The cabs that left to get their next pickups elsewhere are in red, those that chose to wait at the airport are in yellow. We can see that volume peaks at 3pm with almost 300 taxis dropping off, but just under half of them do not stay around for another fare.
Finally, here’s an answer to the question Ben Wellington raised: How long do taxis wait to pickup a new fare at the airport after dropping off? In the wee hours of the day, it’s upwards of 3 hours! During most of the waking hours it’s about an hour, and the mean for the whole 24 hour period is 63.8 minutes. For a small chunk of the evening it dips to 30 minutes.
*Again, I left off an important note on this chart. This is the mean wait time by hour only for those cabs that chose to wait for a fare at the airport.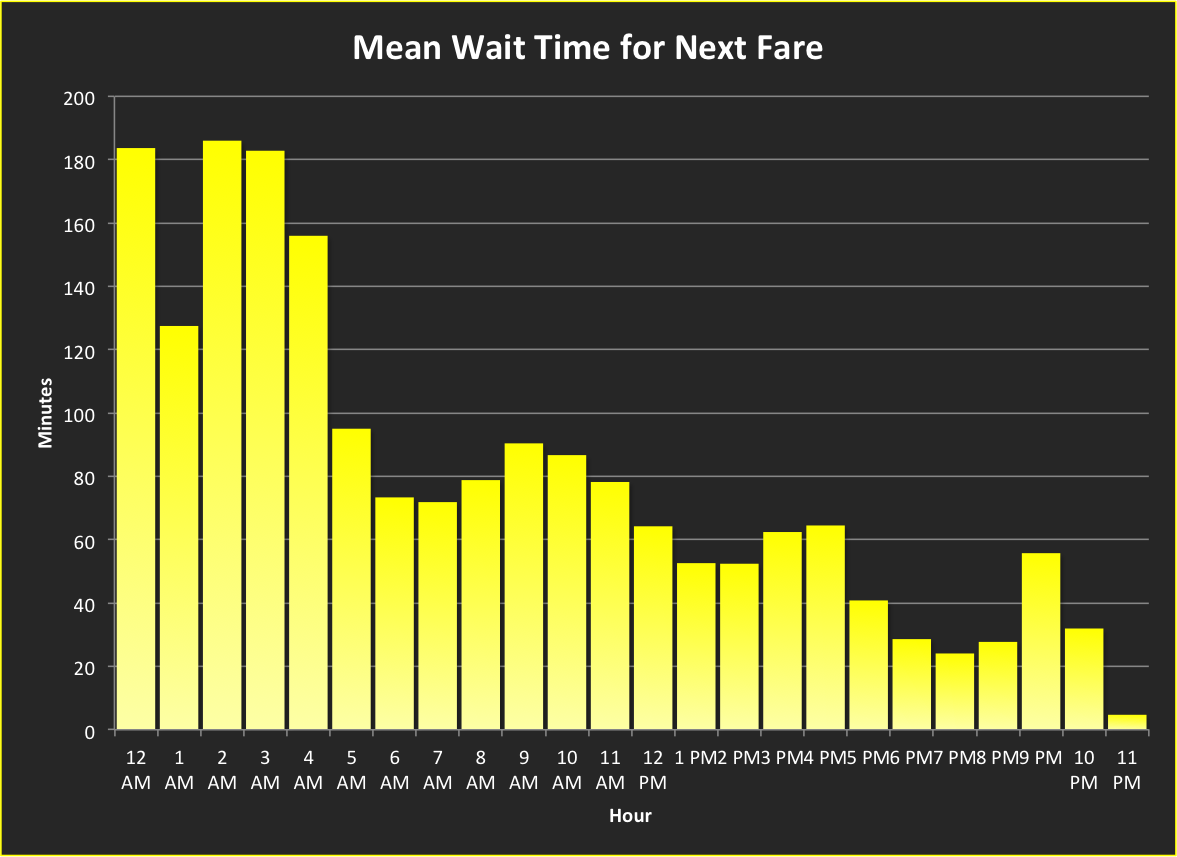
I don’t know enough to have a big takeaway on this analysis yet, but the bars in the last chart represent wasted time & fuel, as these cabs are sitting around in a parking lot at the airport instead of moving people from point A to point B. This indicates that we need a “smarter” system for managing taxi supply and demand at the airport (and managing taxi supply and demand in general).
Next Steps
First I need to figure out where the other 6200 taxis that picked up at the airport that day came from. What are the forces that compel that many vehicles to go to the airport? Was their previous dropoff near the airport and the airport was a good bet to get a fare back to Manhattan?
Next, I want to analyze the departing and arriving flights at JFK on that day (anyone know where I can get historical flight arrival data?) and see how the passenger counts compare to the taxi dropoffs and pickups. I can do this for a couple of days and see if there’s a correlation.
I would love to hear from taxi drivers what their decision factors are when choosing whether to stay or go after dropping off at the airport. Is there a sign that says how full the lot is? Do they have buddies who tip them off about the wait times? Is there some “street knowledge” about what the best course of action is given a time of day or time of year?
Another good analysis would be to look at earnings data for these trips to figure out the incentives to wait so long for what could be a lucrative fare.
I’d like to do an animated visualization of one of the taxi waiting areas, treating the airport as its own system. Cabs can enter the system by dropping off and then going to the waiting area, or going directly to the waiting area. I can infer the wait time for cabs that arrive from elsewhere by analyzing the average wait time for those that dropped off. In theory, I could show the ebb and flow of vehicles entering and exiting the airport, and waiting in the waiting lot over the course of a day.
Thanks for reading! My raw and summarized data is available on github using the getDataButton below.

Leave a Reply