A Chrome Extension to Inject NYC Subway Data into streeteasy.com
I love streeteasy.com. The site has everything for the NYC apartment-seeker: High quality listings, uber-granular searching, discussion forums, and lots of great market insights. However, my recent activity on streeteasy has left me lamenting the fact that NYC’s subway lines aren’t shown in the map view, and subway stops only appear when zoomed in really, really close (and even then they are part of the basemap so they don’t stand out)
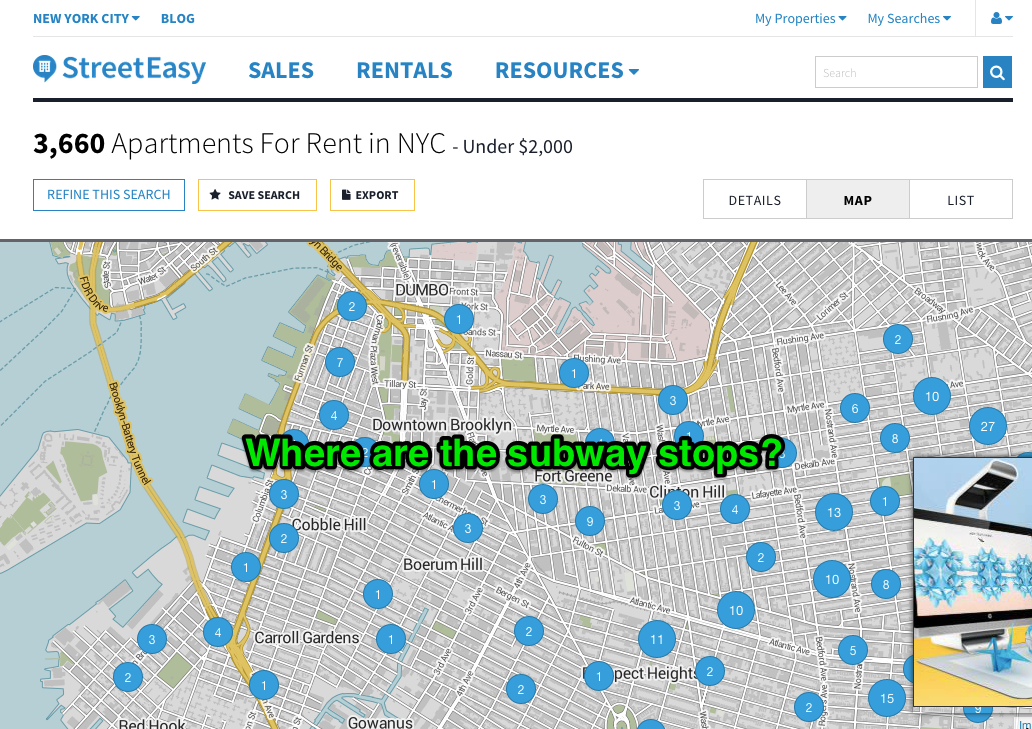
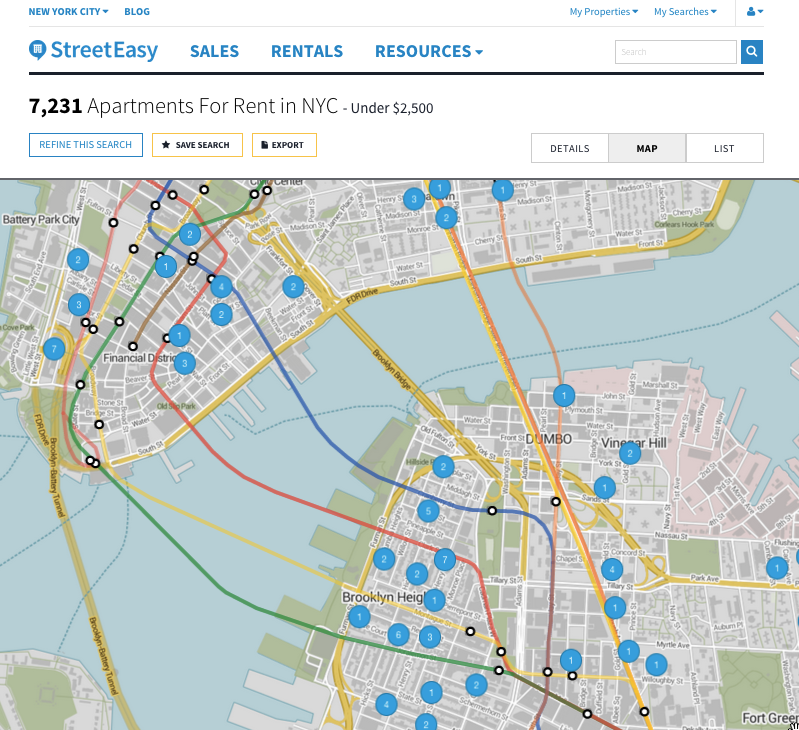
Proximity to transit can be one of the highest priorities for New Yorkers when searching for an apartment, and having them on the map gives a quick visual cue and helps narrow the search. The missing subways inspired me to write a Chrome Extension to inject them into the map. Below is a screenshot of the extension in action. Read on for the gritty technical details.
Why a Chrome Extension?
Chrome extensions are little widgets that run in Google’s Chrome Browser. Some are general purpose tools, such as screen capture utilities, color pickers, or screen rulers. Others tap into the HTML, CSS, and Javascript on websites to extend the site’s functionality. For example, an extension could grab the URL of the current tab and create a bitly shortlink, or allow for quick dictionary lookups of any text on the screen. In my case, the this extension only runs when I visit streeteasy.com, and its whole purpose in life is to inject subway line and stop data into the map elements on the page.
Anatomy of a Chrome Extension
I was delighted to learn that Chrome extensions, not unlike the rest of the web, are just well-structured directories of text files ( Javascript, JSON configurations, a few images, etc.) You can check out the directory structure and files here on gitHub. There’s quite a bit of structure necessary to build even the simplest extension, but luckily someone has built a great site called Extensionizr that will give you a ready-to-hack-on generic extension to download. I won’t get too into the details, but manifest.json contains the main configurations and tells Chrome which sites to run on and what to do when it finds itself on one of these sites. inject.js, as its name suggests, injects my javascript (script.js) into the page.
What kind of Map is this?
A quick peek into the page source on streeteasy.com shows a few mentions of mapbox, whose javascript library is built on Leaflet.js. 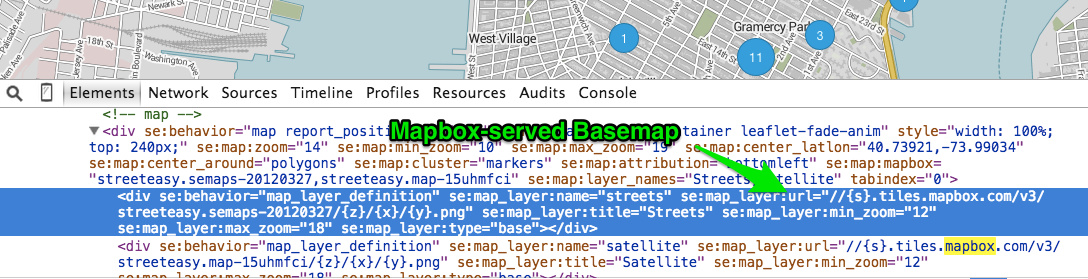 Leaflet.js is a very popular open source mapping library, and allows for the quick creation of “slippy maps” on any website. You tell it what div to put a map in, what URL to use as a source of base map tiles, what data to overlay, and it handles the clicking, dragging, zooming, and other user interaction. Leaflet has a global object L, and typing ‘L’ into the javascript console confirms that Leaflet is indeed loaded, which means we can use its methods to add more layers to the map!
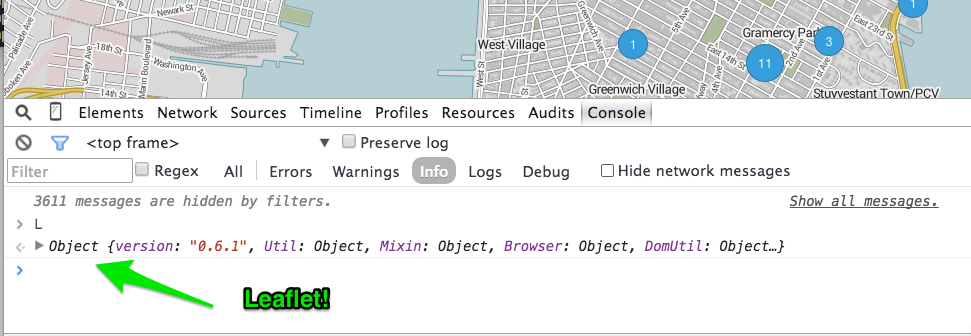
Leaflet makes it quite simple to add geoJSON to the map: L.geoJson(myGeoJson).addTo(myMap); To use this method, I need to get some data for the NYC subway in place of myGeoJson, AND figure out what name streeteasy uses for its map object. (most tutorials will simply call the map object ‘map’, but on a real website this is probably not the case).
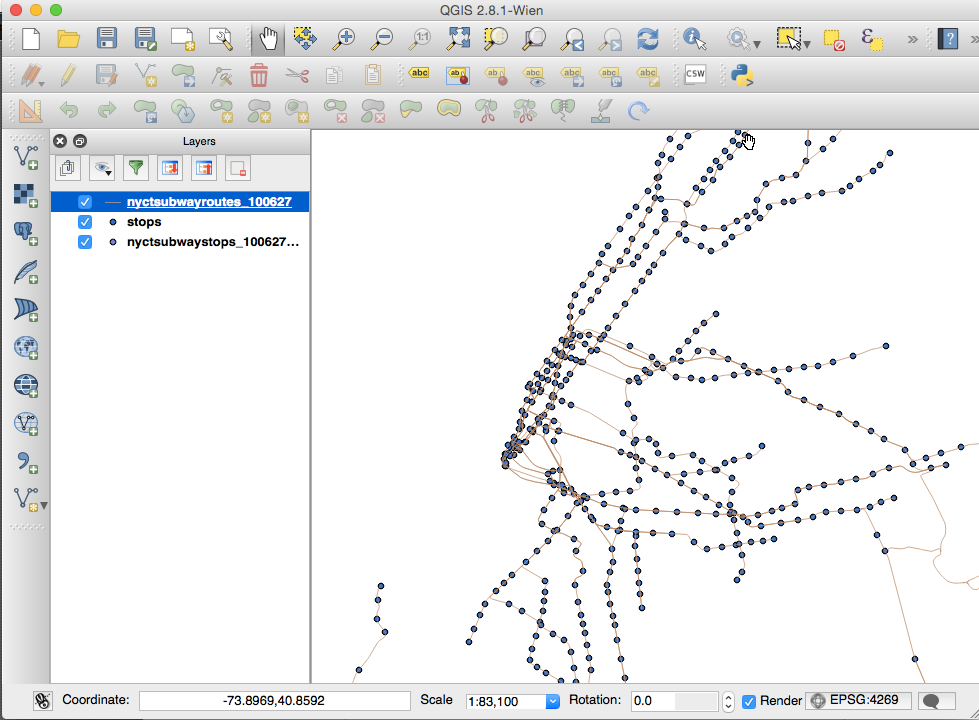
First, the data. NYC data guru Steve Romalewski has a great post about extracting spatial data from New York City’s GTFS schedule data. He’s repackaged it as a Shapefile and shared it so others can use it in their GIS projects. A shapefile isn’t much help to me here, so I first had to use QGIS to convert the data into geoJSON.
Once I had good geoJSON files for the subway lines and stops, I incorporated them into my script.js file using JSON.parse(). (I wanted to store them as separate js files but ran into some issues getting my extension to load them, so variable definitions it is! )
Some more digging through the source of the page led me to SEMaps._maps.map as the map object. Now I have everything to add my new layers to the map. Here’s the code of script.js. After setFeatures() parses out both geoJSON strings, the callback uses L.geoJSON() to add the new layers. Leaflet’s setStyle() method allows me to style the lines based on their route_id property, and for all you transit nerds following along at home, the MTA has a page with the official line colors!
For the stops, I use leaflet’s pointToLayer option to create white circles with black strokes, a common symbology for subway stations.
console.log('Starting injection of NYC subway lines...');

//grab the existing map element from the page
var m = SEMaps._maps.map;

var lines,stops;
setFeatures(function(){

    var linesLayer = new L.geoJson(lines).addTo(m);

    //set the colors for each line based on the route_id property
    linesLayer.setStyle(function(feature){
        switch (feature.properties.route_id) {
            case "1": return {color: "#EE352E"};
            case "2": return {color: "#EE352E"};
            case "3": return {color: "#EE352E"};
            case "4": return {color: "#00933C"};
            case "5": return {color: "#00933C"};
            case "6": return {color: "#00933C"};
            case "B": return {color: "#FF6319"};
            case "D": return {color: "#FF6319"};
            case "F": return {color: "#FF6319"};
            case "M": return {color: "#FF6319"};
            case "A": return {color: "#2850AD"};
            case "C": return {color: "#2850AD"};
            case "E": return {color: "#2850AD"};
            case "G": return {color: "#6CBE45"};
            case "J": return {color: "#996633"};
            case "Z": return {color: "#996633"};
            case "L": return {color: "#A7A9AC"};
            case "N": return {color: "#FCCC0A"};
            case "Q": return {color: "#FCCC0A"};
            case "R": return {color: "#FCCC0A"};
            case "S": return {color: "#808183"};
            case "7": return {color: "#A7A9AC"};
        }
    });

    var stopsLayer = new L.geoJson(stops,{
        pointToLayer: function (feature, latlng) {
            return new L.CircleMarker(latlng, {
                radius: 5,
                fillColor: "#FFFFFF",
                color: "#000",
                weight: 3,
                opacity: 1,
                fillOpacity: 1
            });
        }
    }).addTo(m);
});

function setFeatures(callback) {
   lines = JSON.parse(myReallyLongLinesGeoJsonGoesHere);
   stops = JSON.parse(myReallyLongStopsGeoJsonGoesHere);
   callback();
}
That’s it! You can try this extension out for yourself by following the directions on the github repository. Take a look and let me know what you think. If you’re searching for an apartment, I do not envy you but I hope this helps.
This technique can be used to modify any leaflet map, as long as you can figure out what the map object is called. I look forward to seeing if anyone forks this extension and puts it to use on other websites that need a transit boost.
Most importantly, I hope streeteasy will either add subway lines and stops to their basemap, or overlay them as geoJSON layers just like I did here, so all home-hunting New Yorkers can benefit!
Thanks for reading, happy mapping!
-Chris
Leave a Reply