Liberating Data from NYC Property Tax Bills
Property Tax constitutes the single biggest source of revenue for the New York City Government, accounting for approximately $22.5 Billion dollars in the Modified FY2016 Budget. That’s a lot of money, and I’ve always been curious about how properties are assessed, how exemptions and abatements are applied, and what the overall property tax contribution is of a neighborhood, a block, or any other chunk of the city.
As it turns out, everything about property taxes is public record, but there isn’t really any quality bulk data around about it in NYC. Some aspects of property taxes show their face in PLUTO, including assessed value and abatement, but I learned a few years ago that that’s only part of the story, and you can’t infer from PLUTO how much a property actually pays in taxes. For that information, you have to look at the bills, which are also public record.
The NYC Department of Finance has an online tax bill lookup tool, where you can search for any property by BBL (Borough, Block, and Lot Numbers) or Address. Every statement and bill is available, going back for several years.
Let’s take a look at the bill for 1 Centre Street, a building owned by the city government. The bill for June 2015 is available as a PDF from this URL: http://nycprop.nyc.gov/nycproperty/StatementSearch?bbl=1001210001&stmtDate=20150605&stmtType=SOA
If you scroll down to the 2nd page, you’ll see a nicely formatted section called Annual Property Tax Detail, and here is where you’ll find all of the goodies, including “the bottom line”, or how much that property owes the city for a given tax cycle.
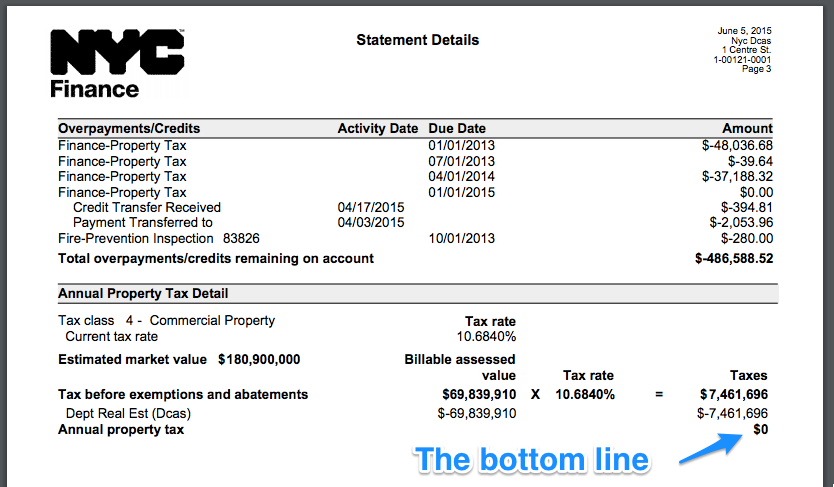
You can see from the bill that if this building were not city-owned, its owner would have to fork over $7.4 Million a year. You can also see that this figure is based on the Billable Assessed Value of $69.8M times the tax rate of 10.6840% for commercial properties. The math is clear, but the source of the Billable Assessed value and the Estimated Market Value are not… but that’s another blog post. (It’s a dissertation, really… Here’s a great article from City&State that talks about several administrations’ failed attempts to reform the property tax system, and how two comparable properties can pay very different taxes based on how fast their neighborhoods appreciated in value. The most interesting tidbit is that renters are shouldering more property tax burden than homeowners, because of the way apartment buildings are taxed.)
Here’s another bill that shows exemptions AND abatements together, saving this owner over $5,000 due to School Tax Relief (STAR) exemption and the Co-op/Condo Abatement: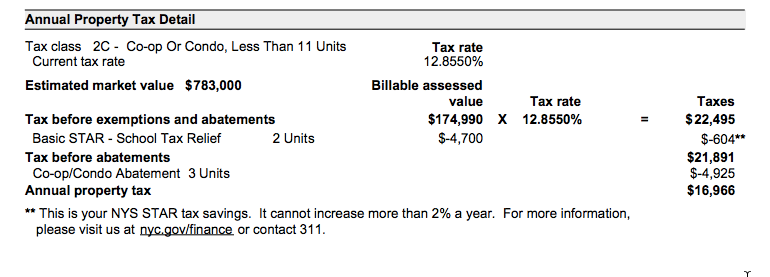
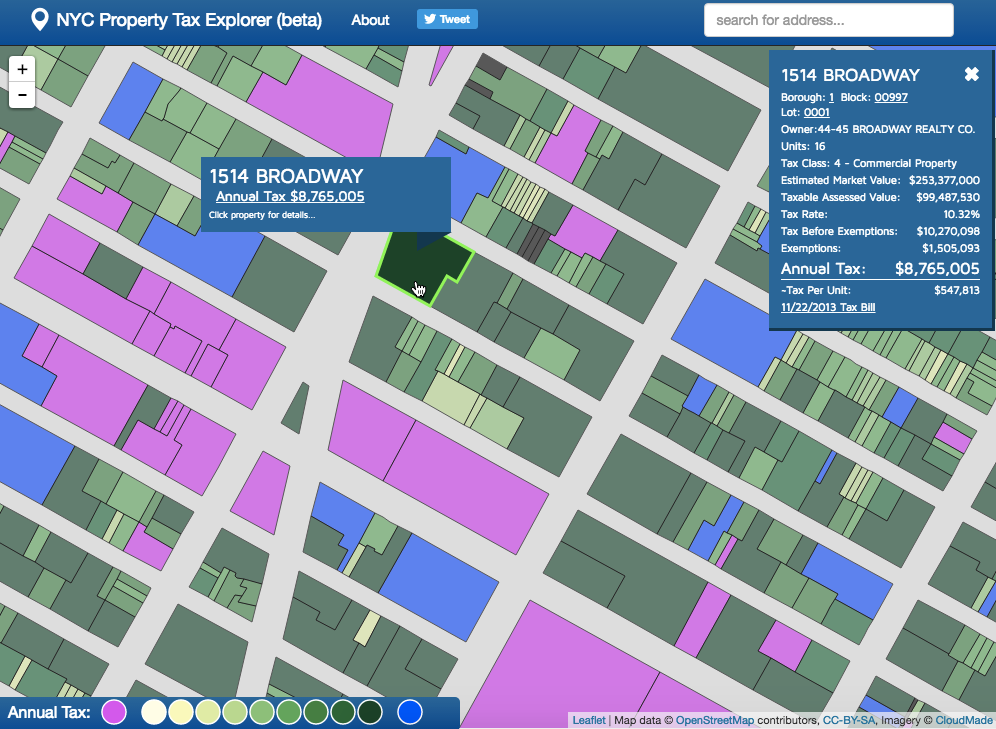
Back in 2013, I put together a little project to extract these nuggets of data, as I wanted to make a simple web map that would allow you to explore property taxes. To accomplish this, we wrote a series of scripts to download thousands of tax bills and scrape the text out of them. The text was then parsed, resulting in machine-readable data for each property we had a bill for. We ended up pulling out most of the data for Manhattan (condos excluded), and the rudimentary map is still up today at nyctaxmap.herokuapp.com (this hasn’t been updated since, and won’t be) It was always my intention to expand it to the rest of the city, and to share the bulk data, but like so many civic hacking projects, it never happened.
Last year, NYC Civic Hacker John Krauss located another gold mine of data in the tax bills, specifically the number of rent stabilized units in an apartment building. Activists and renter’s rights groups had been in search of authoritative data on rent stabilized units, and John figured out that he could get high quality data at the building level by scraping every bill for apartment buildings with over 6 units. He found that surcharges for rent stabilization revealed a massive concentration of stabilized apartment loss in certain neighborhoods. Read his blog post about the rent stabilization data here, and check out the raw tax bills and data at taxbills.nyc. There’s also a great article at ProPublica about the rent stabilization failure-to-report-but-still-getting-the-tax-break situation.
Ben Wellington (iQuantNY) has also done an analysis of the rent stabilization data that was liberated from the tax bills, showing the net change over time among other things. Read it here.
We teamed up to expand taxbills.nyc to include every BBL in the city, condominiums included, with a goal of assembling high-quality granular data including every exemption and abatement in the city. We used MapPLUTO 15v1 as our master list of BBLs, and the DOF assessment rolls to get an exhaustive list of condo BBLs and to join the condo units to their physical tax lot.
Here’s the Data
The data exist in two tables, one with a row for each BBL in the city, containing estimated market value, tax rate, total tax due, etc, and the other containing a row for each individual exemption and abatement found in the bills. There is a one-to-many relationship between these tables, as many exemptions and abatements can be associated with a single BBL.
http://taxbills.nyc/tax_bills_june15_bbls.csv – 1.1 Million Rows
Columns:
address – street address, collected from the bill
bbl – 10-digit Borough, Block, and Lot ID
ownername – owner name, pulled from the bill
condo – ‘lot’ for condo lot BBLs, ‘unit’ for condo unit BBLs, empty for all others
condonumber – corresponding condominium number for condo lot or unit
taxclass – the tax class of the property
taxrate – the tax rate associated with the tax class
emv – estimated market value
bav – billable assessed value
tbea – tax before exemptions and abatements (bav x taxrate)
tba – tax before abatements
propertytax – total tax due (the bottom line)
june15exab.csv – 750K rows
Columns:
bbl – 10-digit Borough, Block, & Lot ID that this exemption or abatement is associated with
type – ‘exemption’ or ‘abatement’
detail – text of the exemption or abatement pulled from the bill
amount – dollar amount of the exemption or abatement
These two tables were derived from the very large rawdata.csv on taxbills.nyc. You can see the exact SQL queries and some other aspects of our methodology on the notes page.
A Few Good Queries
According to the data, the total tax before exemptions and abatements is $34.5 Billion. This is, in theory, the amount the city could collect if there were no exemptions and abatements. I’d love to see what this number would be if real market values were taken into account citywide.
The total tax due (the sum of all of the bottom lines in the bills) is $21.6 Billion, meaning the total amount of tax exemptions and abatements is $12.9 Billion. Of course, many of the exemptions are simply due to the land being owned by a government agency (does it make sense for a city government to pay itself tax? Should cities charge property tax to federal government-owned land in their jurisdictions?)
Let’s take a high-level look at the exemptions and abatements.
There are 147 unique exemption types. There are 42 exemption types with 10 or fewer occurrences. There are 7 with only 1 occurrence: indust waste facility, prof. maj lea sports, nys med care fac fin, patrol salvage, solar/wind energy, state retire system, ltd profit hsng co:l (Someone map these please! Ok, I’ll do it myself, give me a few days)
You can see the full list of all 147 exemptions along with a sum ($) and count column in the table below. I’ll keep my opinions to myself for now and just show you the data.
| detail | sum | count |
|---|---|---|
| park | $-1,235,613,825 | 4242 |
| dept. of education | $-962,818,626 | 1276 |
| port auth-air termin | $-913,424,673 | 39 |
| fed govt land bldgs | $-566,423,433 | 121 |
| icip | $-512,009,171 | 6427 |
| house of worship | $-476,243,408 | 5829 |
| nyc housing auth | $-427,602,366 | 1121 |
| hospital | $-423,899,214 | 478 |
| 421a (20 yr not cap | $-334,361,000 | 291 |
| dept real est (dcas) | $-326,204,300 | 2317 |
| college-university | $-306,038,884 | 298 |
| 421a (15 yr not cap) | $-279,189,007 | 33571 |
| nyc industrial dev | $-254,687,155 | 392 |
| 421a (25 yr not cap | $-252,078,327 | 19785 |
| battery park auth | $-238,561,043 | 3076 |
| new mult dwellings – 421a | $-225,805,259 | 15956 |
| nys urban dev (esdc) | $-223,169,276 | 265 |
| dormitory authority | $-196,179,285 | 156 |
| state lands bldgs | $-188,206,157 | 702 |
| health & hospitals c | $-187,499,525 | 53 |
| dept small bus svcs | $-185,986,785 | 189 |
| j-51 alteration | $-176,986,092 | 22283 |
| edc – pilot | $-154,825,087 | 62 |
| port auth-world trad | $-144,282,806 | 4 |
| bd higher ed (cuny) | $-144,110,833 | 121 |
| 420c housing | $-137,270,998 | 1487 |
| religious-school | $-136,316,447 | 625 |
| basic star – school tax relief | $-131,481,459 | 321063 |
| charitable | $-122,001,696 | 1369 |
| senior citizens homeowners‰Ûª exemption | $-118,970,134 | 44436 |
| school-elem,hs,acad | $-97,272,864 | 278 |
| mta-nyc transit | $-82,620,953 | 237 |
| dept pub work (dep) | $-76,593,333 | 856 |
| post office | $-76,529,620 | 123 |
| roosevelt island | $-70,090,358 | 588 |
| cemetery (private) | $-69,699,532 | 191 |
| student dormitory | $-62,707,580 | 209 |
| enhanced star – school tax relief | $-62,542,225 | 82913 |
| dept of correction | $-60,485,450 | 7 |
| hospital staff hsg | $-60,265,761 | 403 |
| faculty student hsg | $-54,279,562 | 348 |
| dept of sanitation | $-53,215,234 | 133 |
| public museum | $-50,161,235 | 25 |
| house pres devl adm | $-49,520,011 | 1516 |
| spec init pgm (sip) | $-49,093,441 | 774 |
| public library | $-46,087,925 | 191 |
| dept of traffic | $-43,088,377 | 520 |
| nyc educ const fund | $-41,645,783 | 26 |
| 421a (15 yr cap) | $-40,592,345 | 3546 |
| prof. maj lea sports | $-40,234,090 | 1 |
| nfp-contemplated use | $-37,451,904 | 298 |
| fed hospital | $-37,039,566 | 5 |
| police dept | $-36,494,205 | 198 |
| dept of soc svc (hra | $-36,451,518 | 110 |
| foreign mission | $-36,108,239 | 185 |
| united nations | $-35,967,692 | 10 |
| nursing home | $-35,626,822 | 76 |
| mental-moral improve | $-35,484,703 | 289 |
| resid-conv. low manh | $-29,054,091 | 2555 |
| museum | $-28,863,040 | 59 |
| div of alt mgmt prog | $-28,557,598 | 1003 |
| cooper union | $-28,356,603 | 4 |
| chartble philan | $-27,435,310 | 221 |
| opera house | $-26,254,281 | 4 |
| school construc auth | $-26,065,448 | 45 |
| state aided pub hsg | $-25,844,064 | 25 |
| nyc hous auth-duplic | $-25,801,287 | 99 |
| perf arts bldg | $-25,471,471 | 11 |
| armed forces | $-24,736,209 | 5 |
| health center | $-24,220,909 | 117 |
| state hospital | $-23,834,609 | 31 |
| urban dev. act proj. | $-23,677,638 | 9156 |
| urban renewal | $-21,201,190 | 120 |
| dept water resources | $-19,665,961 | 191 |
| port auth-bus facilt | $-19,318,732 | 5 |
| charitable housing | $-19,306,166 | 356 |
| parsonage | $-19,213,798 | 1059 |
| fire dept | $-18,638,363 | 258 |
| benevolent | $-18,069,075 | 144 |
| port auth-indust dev | $-16,820,008 | 50 |
| state public works | $-16,785,619 | 117 |
| veteran exemption | $-15,836,961 | 32132 |
| st assisted priv hsg | $-15,079,766 | 18 |
| trust for cult rsrce | $-14,637,483 | 250 |
| ida – pilot | $-13,208,444 | 48 |
| foreign consulate | $-13,102,555 | 102 |
| academy of music | $-12,826,211 | 9 |
| police fire | $-12,256,973 | 12 |
| un development corp | $-12,161,474 | 6 |
| religious-dormitory | $-11,549,266 | 52 |
| mta – bridge&tunnel | $-11,522,684 | 54 |
| disabled homeowner | $-11,221,103 | 4866 |
| mta-lirr/metro north | $-11,137,726 | 66 |
| state retire system | $-9,863,649 | 1 |
| dept of health | $-9,684,507 | 42 |
| mitchell-lama (srt) | $-9,301,681 | 81 |
| military | $-8,269,903 | 7 |
| hsg dev fund co (srt | $-7,919,965 | 30 |
| dwelling from fed | $-7,253,378 | 25 |
| salvation army | $-6,095,291 | 41 |
| veteran portion fully exempt | $-5,557,900 | 10708 |
| veteran portion partially exempt | $-5,470,235 | 10708 |
| foreign embassies | $-5,459,566 | 49 |
| port auth-bridge/tun | $-4,552,957 | 39 |
| non-profit med dent | $-3,849,513 | 3 |
| dept of highways | $-3,013,486 | 37 |
| 421a (10 yr cap) | $-2,972,734 | 302 |
| foreign staff hsing | $-2,767,134 | 85 |
| literary | $-2,648,013 | 9 |
| armory | $-2,520,941 | 6 |
| fraternal organiz | $-2,236,242 | 5 |
| redevelopment (srt) | $-2,156,074 | 16 |
| nys hous fin agency | $-2,005,203 | 194 |
| hip center | $-1,898,830 | 10 |
| nyc econ dev corp | $-1,688,007 | 8 |
| library | $-1,589,163 | 13 |
| historical | $-1,463,651 | 21 |
| 421b (1-2 family) | $-1,276,105 | 1384 |
| religious missions | $-1,085,091 | 29 |
| a.l.,vfw,cwv,jwv,etc | $-1,058,591 | 65 |
| inst of arts sci | $-895,239 | 5 |
| theatrical corp | $-839,432 | 9 |
| public playground | $-612,755 | 4 |
| scientific | $-539,996 | 9 |
| borough president | $-474,973 | 9 |
| ltd profit hsng co:l | $-423,894 | 1 |
| clergy | $-382,094 | 1331 |
| cemetery (federal | $-265,304 | 2 |
| enf/law/child/animal | $-259,496 | 3 |
| bible | $-245,976 | 2 |
| vol. fire co. | $-228,916 | 13 |
| memorial assn | $-211,529 | 6 |
| amtrak (fed subsi rr | $-151,217 | 3 |
| ny state power auth | $-137,642 | 3 |
| limited div (srt) | $-97,860 | 3 |
| supvd. sportsmanship | $-67,238 | 2 |
| patrol salvage | $-60,998 | 1 |
| nys med care fac fin | $-45,953 | 1 |
| ser disabled veteran | $-24,351 | 4 |
| crime victims | $-21,381 | 6 |
| solar/wind energy | $-12,379 | 1 |
| indust waste facil | $-10,150 | 1 |
| lighthouse | $-9,646 | 3 |
| environ prot ex | $-8,441 | 2 |
| port auth – invalid | $-910 | 3 |
| fallout shelter | $-153 | 2 |
| veteran exemption total | $126,567,562 | 10708 |
Something wonky is going on with that last line “veterans exemption total”. If anyone figures it out, please let me know.
Now the abatements, of which there are 9 distinct types:
| detail | sum | count |
|---|---|---|
| co-op/condo abatement | $-419,578,051 | 41111 |
| j51 abatement | $-85,370,163 | 33884 |
| residential conversion abatement | $-39,932,014 | 2564 |
| industrial & commercial abate prog | $-28,433,537 | 429 |
| lease abatement | $-17,322,212 | 218 |
| brooklyn bridge park pilot | $-4,896,130 | 600 |
| solar elec generating system abate | $-4,643,480 | 2179 |
| mitchell lama star benefit | $-4,550,181 | 135 |
| icip abatement | $-1,180,589 | 84 |
By joining the data with MapPLUTO in CartoDB, we can visualize the tax footprint of the entire city. (Once joined, you can also use the rich lot-level data in PLUTO to analyze property taxes based on zoning, land use, etc) I have colored lots with zero tax due as pink, but bear in mind that it’s often not so simple and things like Payments in Lieu of Taxes (PILOTs) are not reflected in the tax bills. Condo units are outlined in yellow.
So there you have it… we turned 1.1 million pdfs into a high quality open dataset on NYC property taxes, including all exemptions and abatements. Data scientists everywhere, go forth and crunch the numbers, and please share your findings on twitter with me (@chris_whong), John Krauss (@recessionporn) and Ben Wellington (@iquantny). We can’t wait to see what you come up with!
Leave a Reply