An Experimental Twist on the D3 Bubble Chart
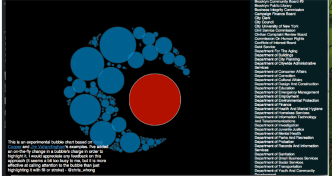
Recently I was playing with charting some data that has a very large range of values, and some outliers with REALLY large values relative …

Recently I was playing with charting some data that has a very large range of values, and some outliers with REALLY large values relative …

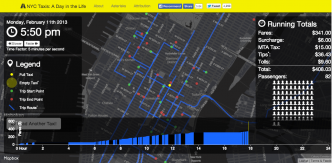
This is part 2 of my techblog about NYC Taxis: A Day in the Life. In part 1, I showed how I …

A week ago, I published NYC Taxis: A Day in the Life and it went a little bit viral. This seems to …

He or she is in there… I promise! The technology landscape has evolved into a perfect storm open source tools and code, …

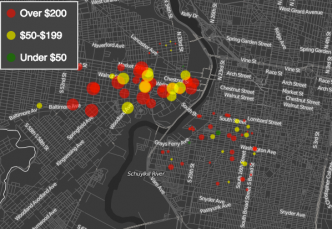
Click to View the Visualization I dropped in on the fellow Code for America Brigade in Philadelphia last weekend, and they happened …